

During the cycle, the ternary system battery cell will have a certain degree of volume change, which is mainly caused by two reasons: one is the expansion of the material structure 1-3, including the expansion of graphite de-intercalation of lithium, and the ternary material H1/H2/H3 Expansion of phase change, cracks caused by stress, etc. The second is gas 4 produced by electrolyte side reactions. For example, C2H4 and H2 are generated in the negative electrode during SEI film formation, and O2, CO, and CO2 are generated during the ternary phase change, as shown in Figures 1 and 2. ![Schematic diagram of capacity loss mechanisms in ternary material Li[NixCoyMn1-x-y]O2 including H1/H2/H3 phase transitions and structural degradation](https://iestbattery.com/wp-content/uploads/2024/07/Figure-1.-Schematic-diagram-of-capacity-loss-of-ternary-material-LiNixCoyMn1−x−yO2.webp "NCM811 Cell Volume Change: Screening Electrolyte Stability via In-Situ Monitoring at 60°C 1")
Figure 1. Schematic diagram of capacity loss mechanisms in ternary material Li[NixCoyMn1−x−y]O2.1
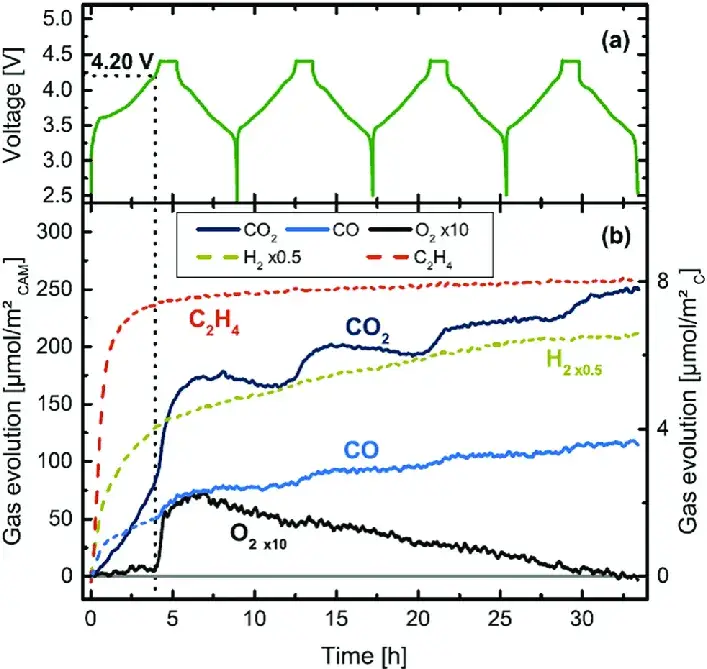
Figure 2. NCM811/Graphite charge and discharge curve with corresponding OEMS gas production curve.4
Model GVM2200 (IEST). Test temperature range: 20°C to 85°C, with dual-channel (2 batteries) simultaneous testing supported.

Figure 3. Appearance of the IEST GVM2200 in-situ battery gassing volume analyzer.
Rest 5 min; 0.5C CC to 4.2 V, CV to 0.025C; rest 5 min; 0.5C DC to 2.8 V.
The cell’s initial mass m₀ is weighed, and the cell under test is placed into the corresponding channel of the device. The MISG software is started, and cell number and sampling frequency parameters are set for each channel — the software automatically reads volume change alongside temperature, current, voltage, and capacity data.
The 60°C cycle volume monitoring data for two groups of NCM811 pouch cells — each using a different electrolyte system — are shown in Figure 4. Comparing the volume change curves, Group B cells begin an abnormal volume increase after approximately 5 cycles, while Group A cells show slow, steady volume growth. This indicates the electrolyte system in Group B is prone to side reactions and gas generation, driving abnormal cell volume increase — a direct example of poor electrode material volume change stability traceable to electrolyte formulation rather than cathode chemistry alone.
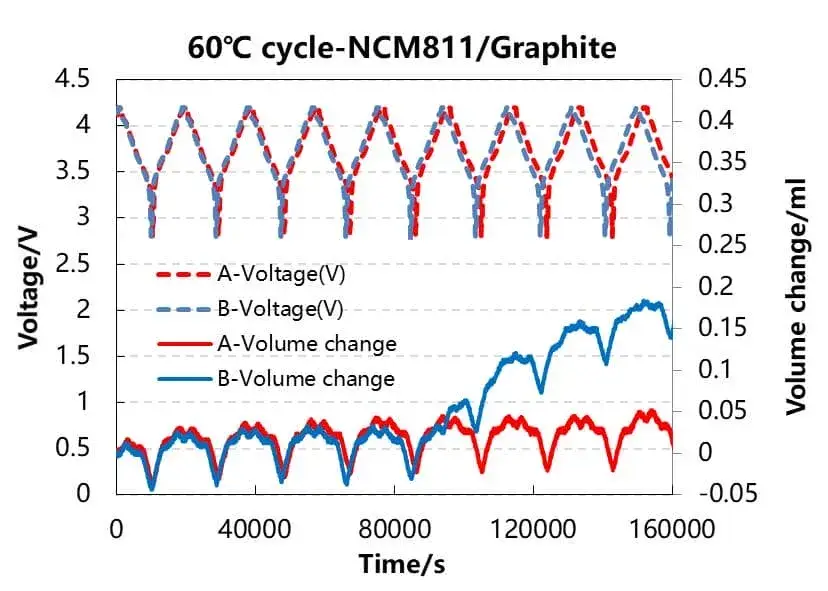
Figure 4. NCM811/Graphite battery charge-discharge and volume change curves comparing two electrolyte systems at 60°C. Group B shows abnormal volume increase beginning around cycle 5.
Further analysis of Group B’s charge-discharge and volume change curves is shown in Figure 5, plotting discharge capacity and cell volume change against cycle number at full discharge. Discharge capacity begins to decrease significantly at cycle 4, and cell volume change increases significantly from the same cycle — showing that the volume increase is directly linked to capacity decay. This is consistent with a mechanism where the side reaction consumes active lithium (driving capacity decay) while simultaneously generating gas (driving volume increase).
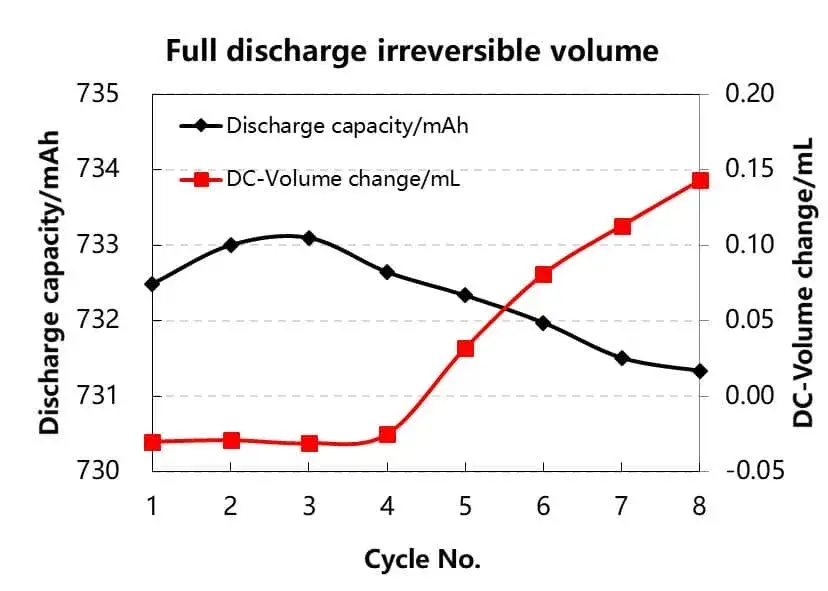
Figure 5. Discharge capacity and cell volume change vs cycle number at full discharge for NCM811 Group B. Both metrics shift at cycle 4, linking capacity decay to gas-driven volume increase.
Continuing the analysis with charge-discharge and relative volume change curves for cycles 1 and 8 of Group B (Figure 6): the difference between the two cycles’ charge-discharge voltage curves is not obvious, but the volume change difference is significant. Cycle 8 volume change during discharge is substantially greater than cycle 1 — attributable to gas production superimposing on the volume change caused by structural phase transitions, increasing the cell’s total volume beyond what structural expansion alone would produce.
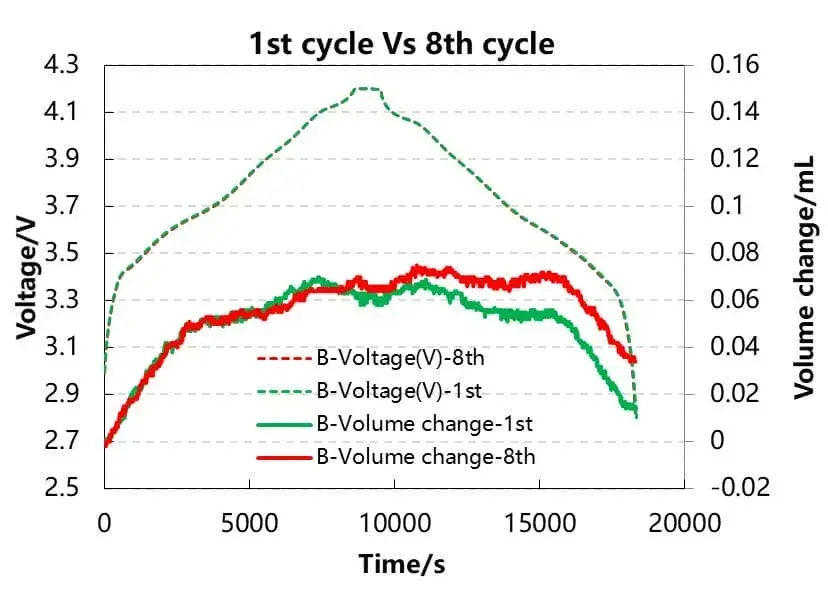
Figure 6. Charge, discharge, and relative volume change curves for cycle 1 vs cycle 8 of NCM811 Group B. Voltage curves are nearly identical, but volume change diverges significantly, revealing accumulated gas generation.
Differential capacity (dQ/dV) analysis of Group B cells (Figure 7 and Figure 8) resolves four charging peaks: peak 1 corresponds to C₆ → LiCx (graphite lithiation); peak 2 to Hexagonal 1 → Monoclinic; peak 3 to Monoclinic → Hexagonal 2; and peak 4 to Hexagonal 2 → Hexagonal 3 — the characteristic H1/M/H2/H3 phase transition sequence of nickel-rich ternary material.4 Correlating the volume change curve with each peak shows that graphite lithium intercalation drives a substantial volume increase, while the H1/M/H2/H3 phase transitions in the ternary cathode sometimes cause the positive electrode material to shrink — partially offsetting and slowing the overall cell volume increase. As cycling progresses, the gap between the charge and discharge volume change curves widens, indicating that irreversible volume expansion accumulates cycle over cycle.
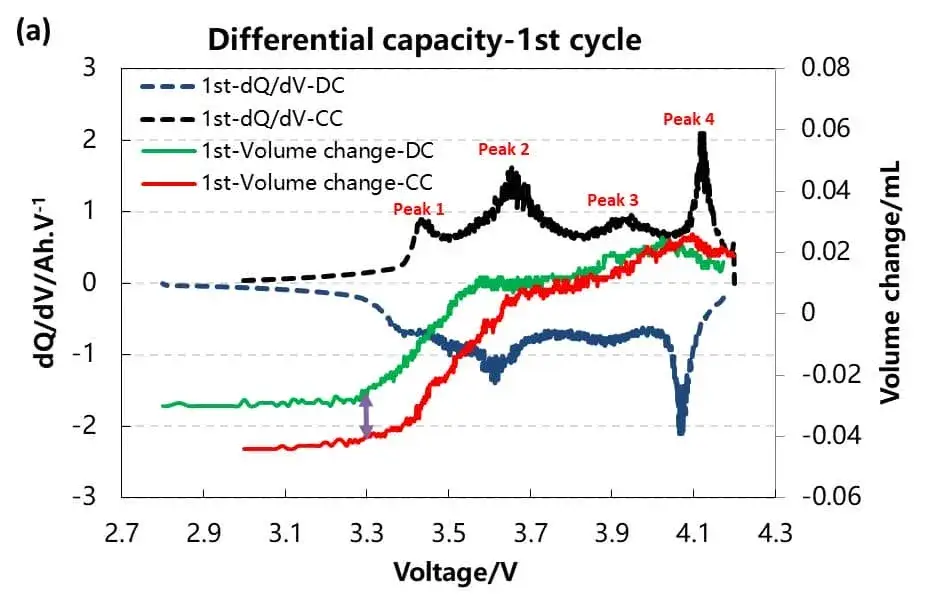
Figure 7. (a) Differential capacity (dQ/dV) and volume change curve of NCM811 Group B battery in cycle 1, showing four characteristic charging peaks.
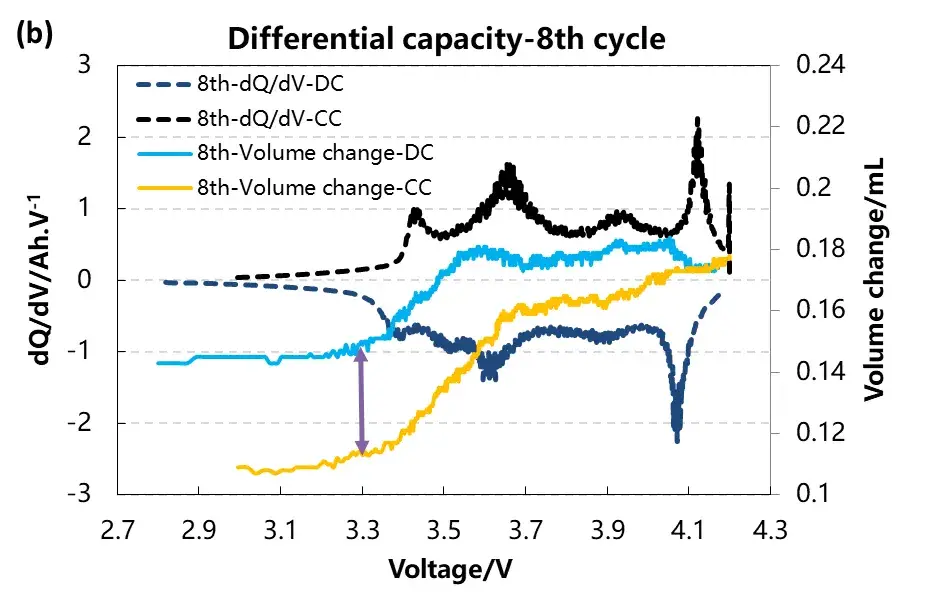
Figure 8. (b) Differential capacity (dQ/dV) and volume change curve of NCM811 Group B battery in cycle 8. The wider charge-discharge volume gap vs cycle 1 confirms accumulating irreversible expansion.
| Parameter | Group A Electrolyte | Group B Electrolyte |
|---|---|---|
| Volume change onset | Slow, steady growth | Abnormal increase after ~cycle 5 |
| Capacity decay pattern | Gradual | Significant decrease starting cycle 4 |
| Volume vs cycle 1 → cycle 8 | Consistent | Substantially larger at cycle 8 |
| Charge-discharge voltage curve shape | — | Nearly identical cycle 1 vs 8 (masks the volume divergence) |
| Inferred mechanism | Lower side-reaction gassing | Active lithium consumption + gas generation (C2H4, H2, O2, CO, CO2) |
| Electrolyte formulation suitability | Favorable for high-temperature cycling | Requires reformulation before scale-up |
This study uses a temperature-controllable, dual-channel in-situ volume monitor to analyze the volume changes of NCM811/graphite cells with two different electrolyte systems during high-temperature cycling, enabling direct, intuitive evaluation of gas production for each electrolyte system. Beyond gassing detection, the volume change corresponding to material phase transitions during lithium intercalation/de-intercalation is also resolvable — helping developers analyze both material and electrolyte performance mechanistically rather than relying on end-of-life capacity data alone. This approach to electrode material volume change stability screening provides an early, mechanism-level signal for electrolyte formulation decisions well before full cycle-life testing would reveal the same failure.
[1] Hoon-Hee Ryu, Kang-Joon Park, Chong S. Yoon, and Yang-Kook Sun. Capacity Fading of Ni-Rich Li[NixCoyMn1−x−y]O2 (0.6 ≤ x ≤ 0.95)Cathodes for High-Energy Density Lithium-Ion Batteries: Bulk or Surface Degradation. Chem. Mater. 2018, 30, 1155−1163;
[2] Shiyao Zheng, Yong Yang et al. Correlation between long range and local structural changes in Ni-rich layered materials during charge and discharge process. J. Power Sources. 2019,412,336–343;
[3] Aleksandr O. Kondrakov et al. Anisotropic Lattice Strain and Mechanical Degradation of High- and Low-Nickel NCM Cathode Materials for Li-Ion Batteries. J. Phys. Chem. C 2017, 121, 3286−3294
[4] Roland Jung et al. Oxygen Release and Its Effect on the Cycling Stability of LiNixMnyCozO2(NMC) Cathode Materials for Li-Ion Batteries. J. Electrochem. Soc. 2017, 164 A1361
NCM811 cell volume change during cycling arises from two distinct sources. First, material structure expansion: graphite lithium de-intercalation on the anode side, and H1/H2/H3 phase transitions plus stress-induced cracking in the nickel-rich ternary cathode. Second, gas generation from electrolyte side reactions — C₂H₄ and H₂ produced during SEI film formation at the anode, and O₂, CO, and CO₂ produced during ternary cathode phase changes. In-situ volume monitoring at controlled temperature can separate the contributions of these two mechanisms by comparing volume change patterns across cycles and electrolyte formulations.
In-situ volume monitoring evaluates electrode material volume change stability by tracking cell volume continuously during high-temperature cycling and comparing the pattern between electrolyte systems. A stable, low-gassing electrolyte produces slow, steady volume growth dominated by reversible structural expansion. An unstable, gas-prone electrolyte produces an abnormal volume increase that appears early in cycle life — in one comparison, an unfavorable electrolyte system showed abnormal volume growth after only about 5 cycles, while a more stable system showed gradual growth throughout testing. This distinction is often invisible in the charge-discharge voltage curve alone, making direct volume monitoring a more sensitive early-warning tool than capacity fade tracking.
NMC cathode volume change correlates with capacity decay because both are frequently driven by the same underlying side reaction. When electrolyte decomposition or side reactions consume active lithium, capacity declines; the same side reactions typically generate gas (such as O₂, CO, and CO₂ from cathode-side reactions, or C₂H₄ and H₂ from anode SEI reactions), which increases cell volume. In one NCM811/graphite dataset, discharge capacity began decreasing significantly at cycle 4, and cell volume change increased significantly starting from the same cycle — directly linking the two metrics to a common gas-generating degradation mechanism rather than two independent phenomena.
The four differential capacity (dQ/dV) peaks observed during charging of an NCM811/graphite cell correspond to sequential phase transitions in the two electrode materials. Peak 1 corresponds to C₆ → LiCx, the graphite lithiation reaction. Peaks 2 through 4 correspond to the characteristic phase transition sequence of the nickel-rich ternary cathode: Hexagonal 1 → Monoclinic (peak 2), Monoclinic → Hexagonal 2 (peak 3), and Hexagonal 2 → Hexagonal 3 (peak 4). Correlating each peak with the simultaneous volume change signal shows that graphite lithiation drives substantial volume increase, while certain H1/M/H2/H3 cathode transitions can cause the cathode material to shrink slightly, partially offsetting the overall cell volume increase.
Irreversible volume expansion in ternary material (NCM) cells accumulates progressively with cycle number, visible as a widening gap between the charge-phase and discharge-phase volume change curves. Comparing cycle 1 to cycle 8 of an NCM811/graphite cell under high-temperature cycling, the charge-discharge voltage curve shapes remained nearly identical between the two cycles, but the volume change during discharge at cycle 8 was substantially greater than at cycle 1 — the difference attributable to gas generation superimposing on top of the reversible structural volume change. This growing gap is a direct, quantitative signature of accumulating irreversible expansion that voltage-based cycling data alone does not reveal.
