-
iestinstrument
Analysis of LiFePO4 Cell Swelling Thickness And Swelling Force
LiFePO4 cells are often used as power trams or energy storage devices with high power or high security requirements because of their high security and stability. As the capacity of a single cell rises, its expansion during charging and discharging increases. Usually, to analyze the expansion behavior of a cell, the cell expansion thickness or expansion force parameter is used, but the test modes of these two are different, and we have previously analyzed the differences between these two aspects of lithium cobalt oxide system cells1. For more information, please refer to the article, “In-situ Expansion Analysis of Pouch Cell: constant Pressure Vs Constant Gap”. In this paper, we conduct a comparative analysis of the expansion thickness and expansion force of large capacity LiFePO4 cells to explore their expansion behavior during the charge and discharge process.
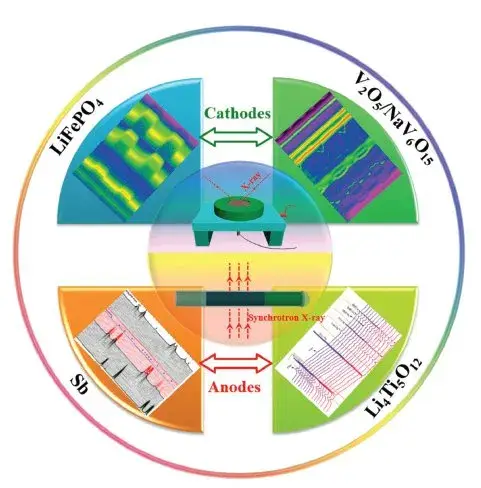
Figure 1. In-situ XRD characterizes the lattice changes of different materials1
1. Experimental Equipment and Test Methods
1.1 Experimental Equipment: In-situ swelling analyzer, model SWE2110, the appearance of the equipment is shown in Figure 2.
Figure 2. Appearance of SWE2110 Equipment
2. Test Process
2.1 Cell Information is Shown in Table 1.
Table 1. LiFePO4 Cells Information
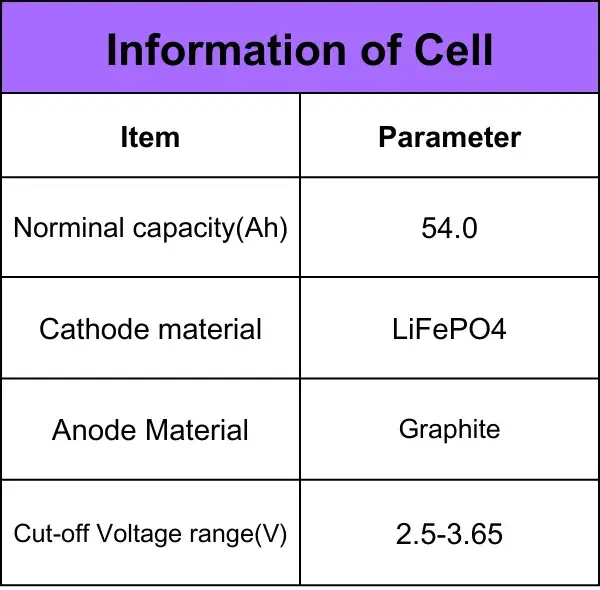
2.2 Charging and Discharging Process: 25℃ Rest 5min; 1C CC to 3.65V, CV to 0.025C; rest 5min; 1C DC to 2.5V.
2.3 Thickness Swelling Test of Cell: Put the power to be tested into the corresponding channel of the device, open the MISS software, set the cell number and sampling frequency parameters corresponding to each channel, and the software automatically reads the cell thickness, thickness change, test temperature, current, voltage, capacity and other data.
3. In-situ Analysis of Swelling Behavior of LiFePO4 Cell
3.1 Equipment Stability Verification
In this paper, two different test modes of the In-situ swelling analyzer(SWE2110) are used to test the variation of the expansion thickness of the LiFePO4 cell under constant pressure conditions and the variation of the expansion force of the LiFePO4 cell under constant gap conditions. The verification about the control stability of the equipment is shown in Figure 3. When the constant pressure is set to 35 kg and 400 kg, respectively, the fluctuation of the pressure during the whole testing process is ±1 kg, and when the constant gap is set, the variation of the gap during the whole testing process is within ±1 µm, which indicates that the control accuracy and stability of the equipment itself is very good.
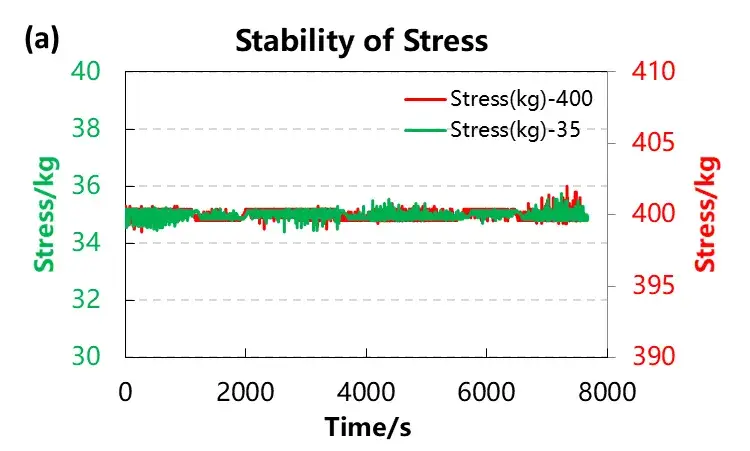
Figure 3. (a) Stability curve for constant stress
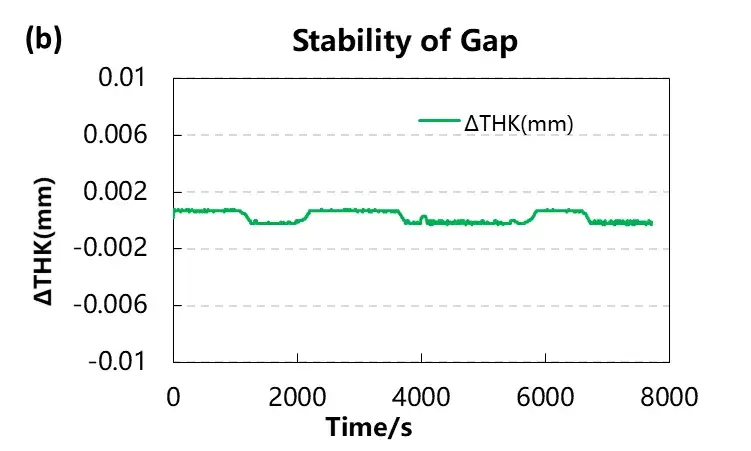
Figure 3. (b) Stability curve of gap under constant pressure and constant gap
3.2 Swelling Thickness Curve Under Two Different Pressure Conditions
Figure 4 shows the charging and discharging curves, differential capacity curves, and thickness expansion curves of the cell. For the LFP/graphite system cell, during the charging process, the thickness curve also shows a slight decrease, and the thickness decrease occurs at the second embedded lithium potential in graphite, which is likely to be related to the fact that when the lithium ions are detached from the olivine structure of the LFP material, the thickness of the anode side decreases, which then offsets the increase in the thickness of the embedded lithium of the anode, and thus the cell as a whole exhibits the phenomenon of thickness decrease, which can be further analyzed with the help of the in-situ XRD for further analysis. When different constant pressures are applied to the LiFePO4 cell, the maximum expansion thickness of the LiFePO4 cell increases with increasing pressure.
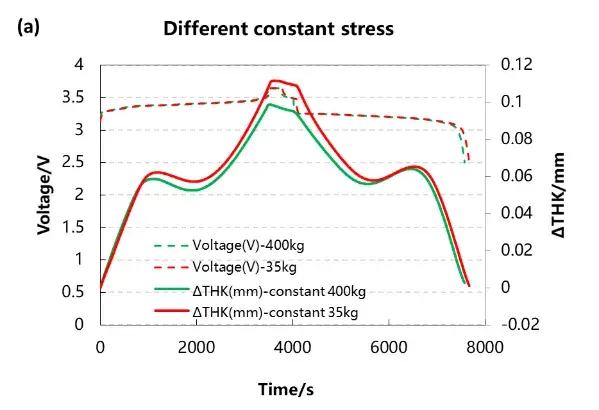
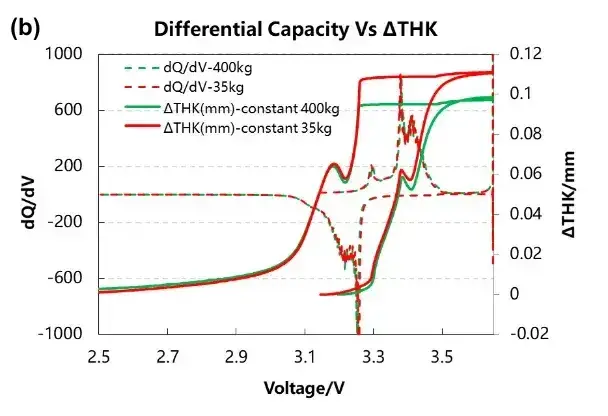
Figure 4. Charge/discharge curves, differential capacity curves, and thickness expansion curves of battery cells under two different pressure conditions
3.3 Comparison of Swelling Force and Swelling Thickness Curve During Charging and Discharging
Figure 5 shows the comparison of the swelling force and the swelling thickness curve of the LiFePO4 cell under two different test mode conditions. During the charging and discharging process, the swelling trend of force and thickness is the same, and decreases when charging occurs in the range of 25% to 70% SOC. The phenomenon of increase during electricity, this interval is the main deintercalation lithium phase transition interval, and also the interval where the internal resistance of the LiFePO4 cell is relatively small. How to further analyze the swelling and contraction mechanism of the cathode and anode electrodes requires joint research with other characterization methods.
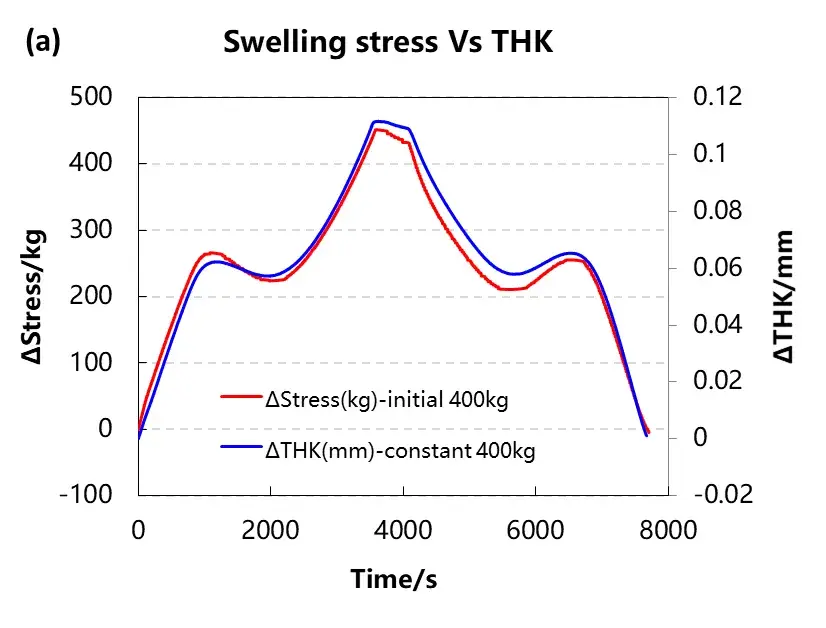
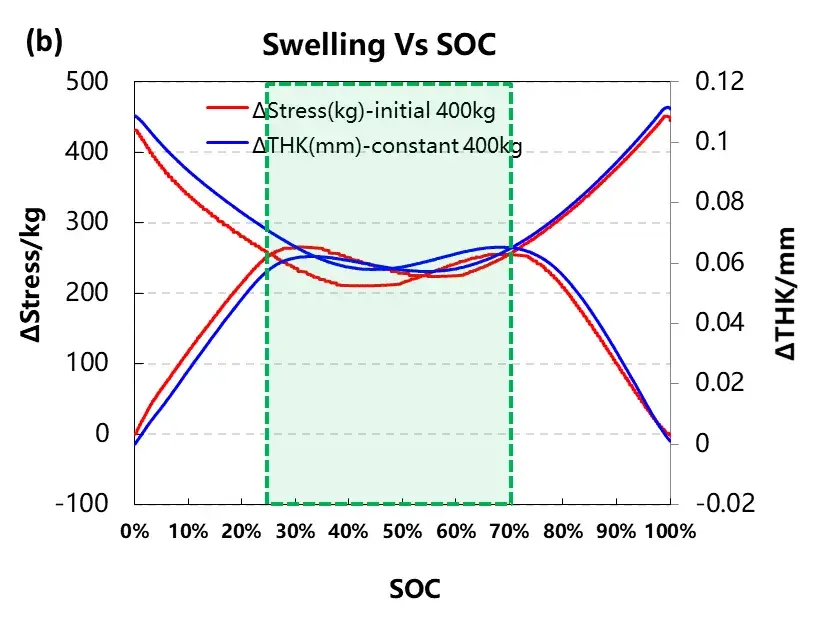
Figure 5. Comparison of expansion force and expansion thickness curves under two different test modes
4. Summary
In this paper, an in-situ swelling analyzer (SWE) is used to compare the swelling thickness and swelling force of large capacity LiFePO4 cells. It is found that during the charging and discharging process, the swelling trend of force and thickness is the same, and it decreases when charging occurs in the range of 25% to 70% SOC. The phenomenon of increase during discharge, how to further analyze the swelling and contraction mechanism of the cathode and anode electrodes, also needs to be combined with other characterization methods to jointly study.
5. References
[1] Xiujuan Wei, Xuanpeng Wang, Qinyou An, Chunhua Han, and Liqiang Mai. Operando X-ray Diffraction Characterization for Understanding the Intrinsic Electrochemical Mechanism in Rechargeable Battery Materials Small Methods 2017, 1700083.
Subscribe Us
Contact Us
If you are interested in our products and want to know more details, please leave a message here, we will reply you as soon as we can.


