-
iestinstrument
In-situ Analysis Of the Expansion Performance Of Silicon Carbon Cells
In this paper, in-situ expansion thickness tests are conducted on pouch cells prepared from two different ratios of mixed silicon carbon cell materials (specific capacities of 450 mAh/g and 800 mAh/g, respectively) to compare and analyze the differences in the expansion properties of the two.
In order to enhance the energy density of batteries, improvements in materials and processes are needed. The theoretical ratio capacity of silicon based material forming Li xSi (x=0~4.4) alloy in the process of lithium embedding is about 4200mAh/g, much greater than the commonly used graphite material of 372mAh/g. Therefore, silicon based material becomes the most potential anode material to enhance the energy density of the battery. However, due to the serious volume swelling and contraction of silicon anode electrode in the process of removing lithium, the poor battery circulation performance has limited its wide application in the lithium industry. How to effectively inhibit the swelling of silicon anode electrode has become an urgent difficulty to overcome in the lithium industry. At present, most of the silicon-based anode materials that can be actually used are silicon carbon cells mixed according to a certain proportion to explore the impact of different mixing ratios on the battery swelling performance, which will help researchers to deepen the understanding of the swelling of silicon-based materials and make corresponding improvement measures, and accelerate the wide application of silicon-based materials.
![]()
Figure 1. Overview of silicon-graphite composite electrodes 1
1. Experimental Equipment and Test Methods
1.1 Experimental Equipment
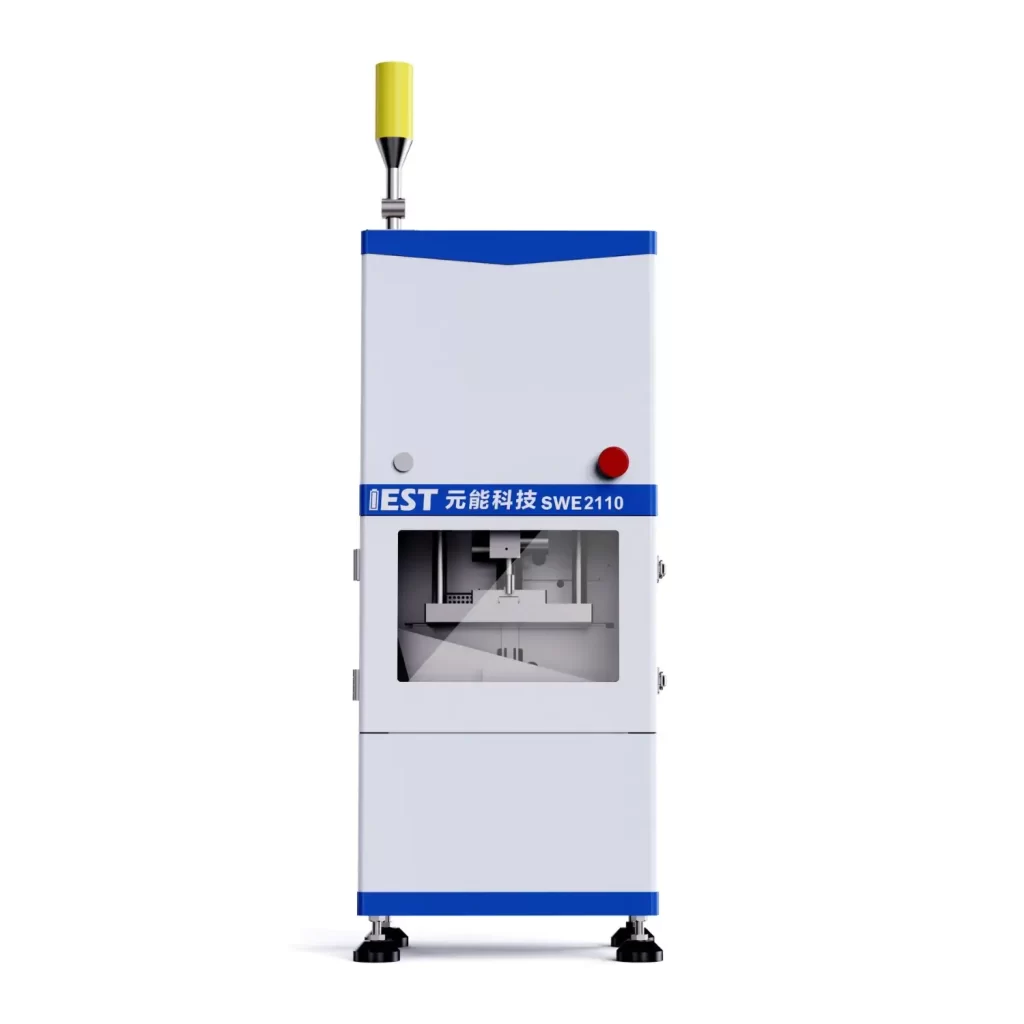
In-situ swelling analyzer, model SWE2110 (IEST), the equipment appearance is shown in Figure 2.
Figure 2. SWE2110 Equipment Appearance
1.2 Test Methods
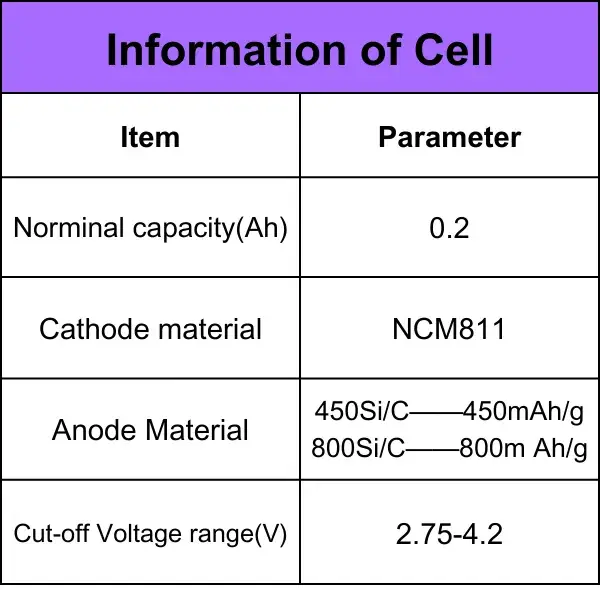
1.2.1 The cell information is shown in Table 1.
Table 1. information of cell
1.2.2 Charging and Discharge Process
25℃ Rest 5min; 0.5C CC to 4.2V, CV to 0.025C; rest 5min; 1C DC to 2.75V
1.3 Cell Thickness Swelling Test
Put the cell to be tested into the corresponding channel of the equipment, open the MISS software, set the corresponding cell number and sampling frequency parameters of each channel, and the software automatically reads the cell thickness, thickness variation, test temperature, current, voltage, capacity and other data.
2. In-situ Analysis of Silicon Carbon Cell Swelling Behavior
Figure 3 and Figure 4 shows the cell charge and discharge curve and the thickness swelling curve. In the process of charge and discharge, the thickness of the cell increases and then decreases, which is mainly related to the transition of the silicon carbon structure. When lithium constantly exits from the positive electrode and enters the negative electrode structure, lithium forms Li xSi alloy with silicon and LiCx intercalation compound with graphite will cause negative swelling, which can further analyze silicon and graphite swelling behavior combined with the differential capacity curve.
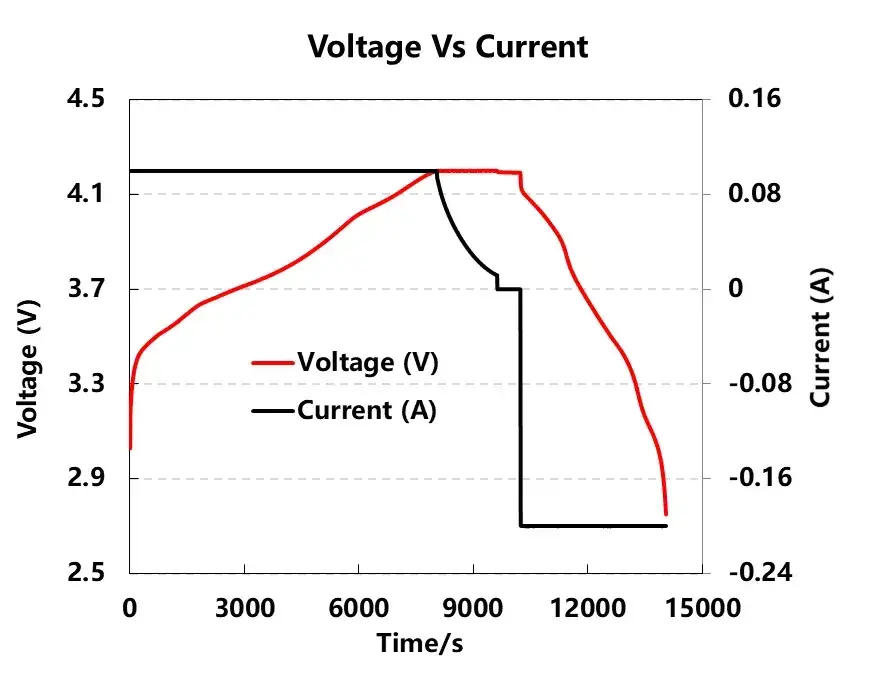
Figure 3. Cell charge and discharge curve
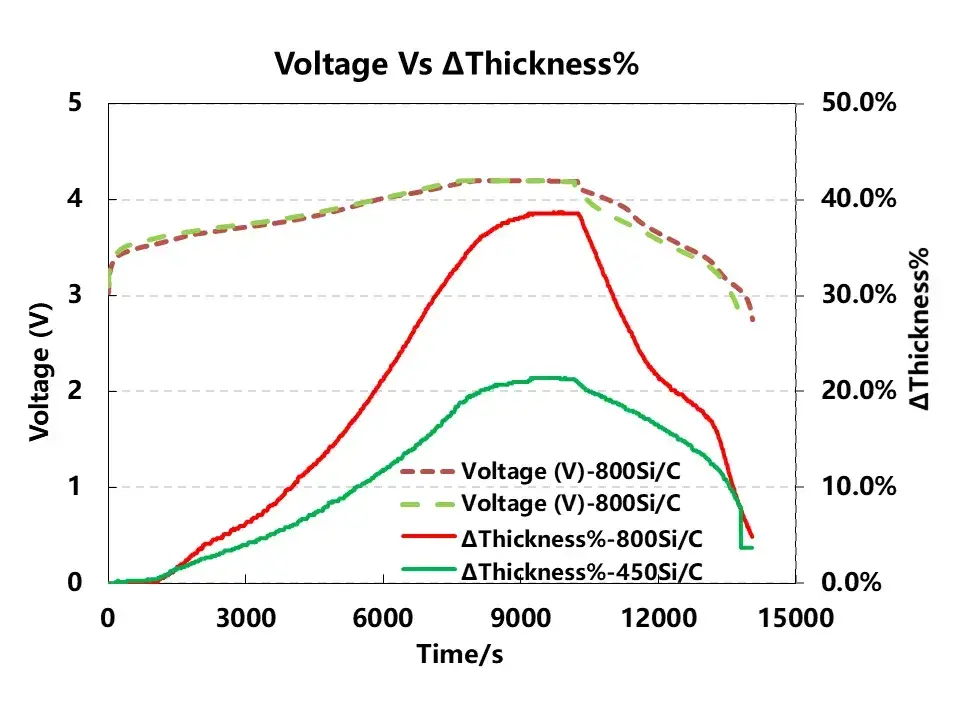
Figure 4. Cell thickness swelling curve
Figure 5 shows the comparison of the differential capacity curve and the thickness swelling curve of the cell. From the differential capacity curve, three obvious off-embedded lithium peaks appeared in both the charging and discharge processes, and the positive electrode of this cell is NCM811, and the negative electrode is silicon carbon cells materials with different grams of capacities respectively. Compared with the peak2 of the two cells, this peak is mainly the phase transition site of NCM811, while compared with peak1 and peak3, 800Si/C is significantly greater than 450Si/C, shows that when Si is more, the formation of silicon carbon cell alloy is also more, and then causes more thickness swelling when charging.
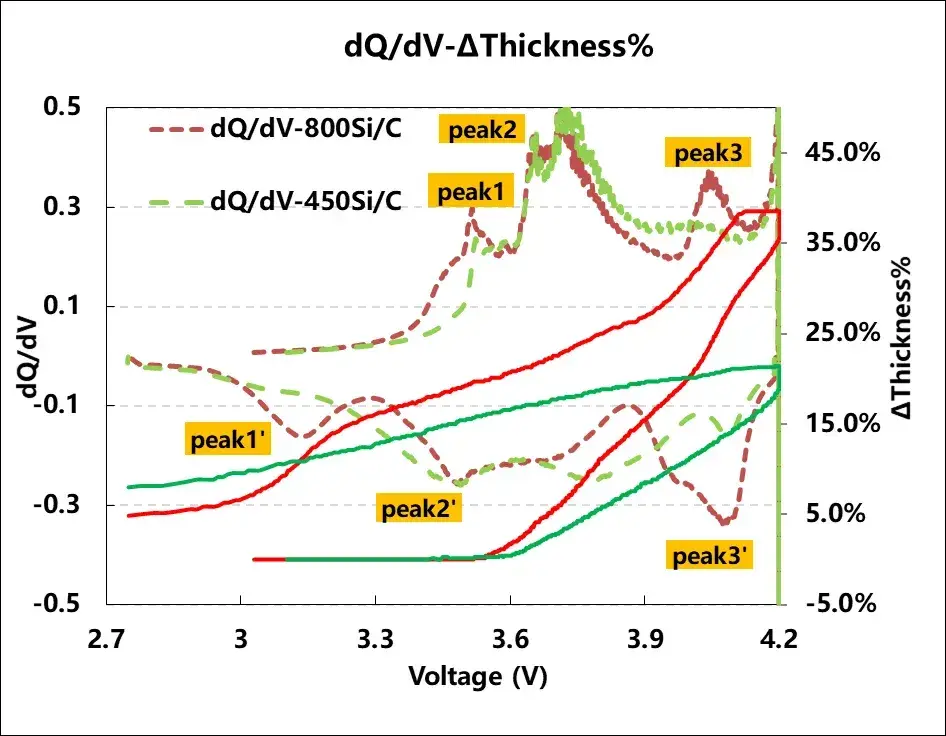
Figure 5. Charge-discharge differential capacity curve and thickness expansion curve
3. Summary
In this paper, an in-situ swelling analyzer (SWE Series) is used to analyze the thickness expansion of silicon carbon cells with different gram capacity, and it is found that with the increase of the gram capacity of silicon carbon anode, the expansion thickness of the silicon carbon cells increases, which is mainly related to the expansion of the silicon structure during the formation of silicon carbon alloys, and the R&D personnel should rationally control the ratio of silicon to carbon and modify the structure of silicon-based materials to inhibit the expansion of the structure, so as to ensure that the battery has good cycling stability.
4. References
[1] Peng Li, Hun Kim, Seung-Taek Myung, Yang-Kook Sun Diverting Exploration of Silicon Anode into Practical Way: A Review Focused on Silicon-Graphite Composite for Lithium Ion Batteries .Energy Storage Materials , 35(2021) 550-576.
[2] Andressa Y.R.Prado, Marco-Tulio F.Rodrigues, Stephen E.Trask, Leon Shaw and Daniel P.Abraham.Electrochemical Dilatometry of Si-bearing Electrodes: Dimensional Changes and Experiment Design, J.Electrochem.Soc.167 160551.
[3] Sujong Chae, Minseong Ko,Kyungho Kim, Kihong Ahn and Jaephil Cho.Confronting Issues of the Practical Implementation of Si Anode in High-Energy Lithium-Ion Batteries .Joule 1, 47–60, September 6, 2017.
Subscribe Us
Contact Us
If you are interested in our products and want to know more details, please leave a message here, we will reply you as soon as we can.


