-
iestinstrument
Slurry Dispersion Analysis and Electrochemical Performance Control
1. Author Information and Article Abstract
In 2019, the Kentaro Kuratani team used the slurry viscosity and CT imaging characterization of different mixing methods to visually see the slurry dispersion state. Further combining with the rate performance of the button, it is found that the discharge capacity corresponding to the highly slurry dispersion is the lowest, indicating that the best slurry dispersion is not conducive to the battery capacity.
2. Experimental Information
Three Kinds of Slurry Preparation Process
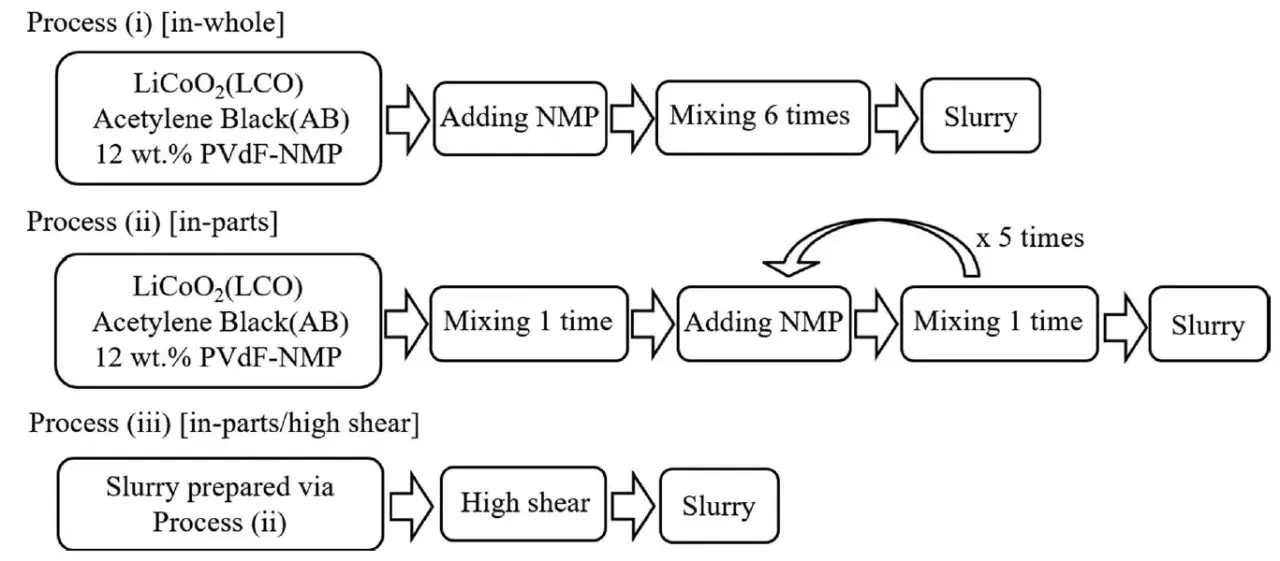 Figure 1. Slurry preparation process
3. Test Items
Slurry viscosity, electrode CT imaging, and buckling multiplicity performance. Where the CT 3D imaging steps are shown in Figure 2, the final blue solid phase is the LCO particles and the pores represent several other materials.
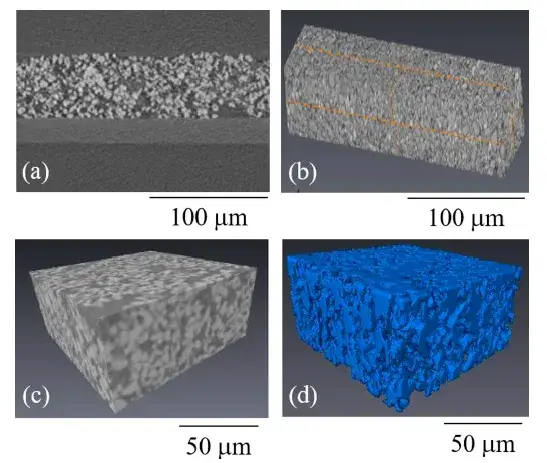
Figure 2. Electrode 3D imaging steps
4. Analysis of Results
4.1 Slurry Viscosity of Three Mixing Processes
Comparing the viscosity curves of the three mixing processes, it can be found that there is no significant difference in the viscosity curves of the three at low shear rates (<1s-1). In the speed range of 1s-1~100s-1, the three kinds of viscosity decrease trends are different. Among them, the decline trend of the slurry viscosity in the in-part+high shear mode is greater than that of the other two.This may be related to the different particle dispersion states caused by different methods, which need to be further combined with the following characterization methods to analyze.
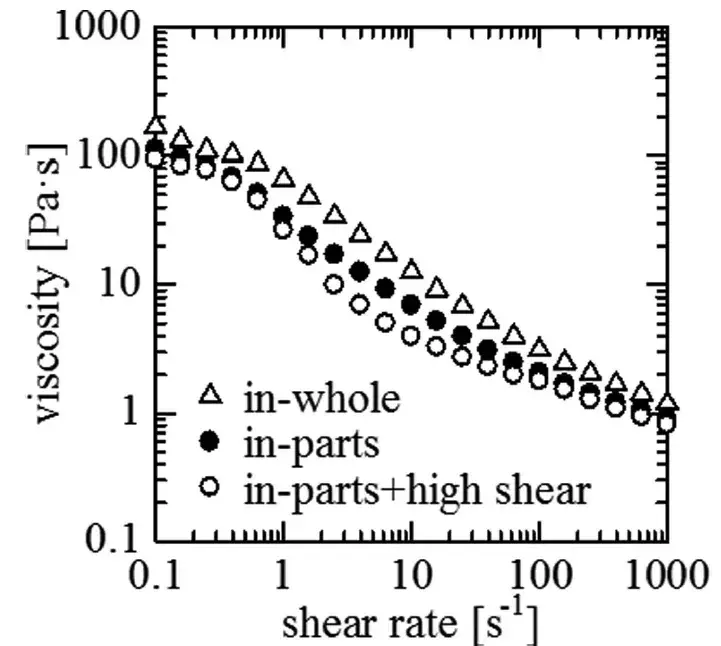
Figure 3. Slurry viscosity profiles for three mixing processes
4.2 Electrode CT Imaging
It can be seen from the CT image that it can be seen from the CT image that in the electrode coated with in-whole slurry, large particles are more agglomerated, and the second in-parts method has significantly reduced agglomerated particles.However, in the in-part+high shear method, there are almost no large particles agglomerated in the electrode, which shows that the particle dispersion state of these three stirring methods is very different.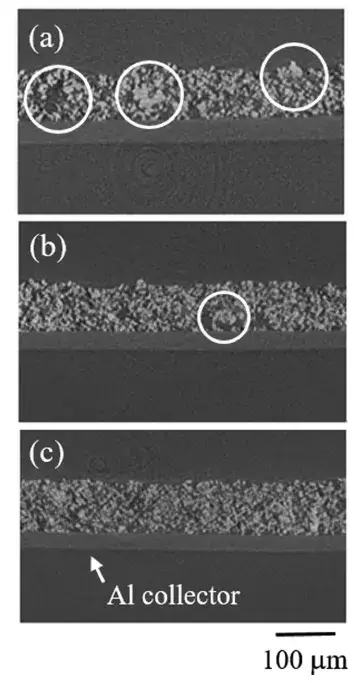
Figure 4. Electrode CT imaging with three stirring methods
4.3 Button Cell Electrochemical Performance
It can be seen from the discharge capacity data of different current densities that with the increase of the discharge current density, when the discharge current density reaches 1000mA/g, the capacity attenuation corresponding to the in-part/high shear stirring method is significantly greater than that of the other two. The discharge voltage curve also found that the voltage drop of this stirring method is the largest. Combined with the CT image of the electrode, we can infer that the best dispersive agitation method will disconnect the conductive carbon network, and the electronic conduction of the electrode will decrease. Therefore, the polarization will be larger and the capacity will decrease at high current density. When the cycle is continued with a small current density, the capacity of the three types of deduction is restored to the same.
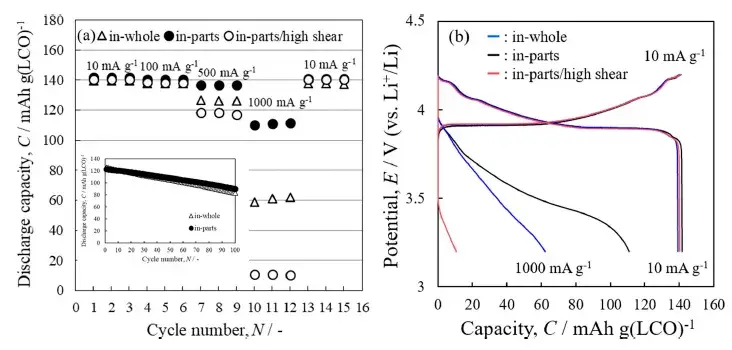
Figure 5. Buckling multiplier performance of the three stirring methods

Figure 6. Schematic of particle dispersion for three mixing methods
5. Summary
In this paper, through the characterization of the slurry viscosity and CT imaging of different stirring methods, the slurry dispersion state can be seen intuitively, and further combined with the rate performance of the deduction, it is found that the discharge capacity of the slurry with high dispersion is the lowest. It shows that when the slurry dispersion is the best, it is not conducive to the battery capacity. This is mainly because when the slurry dispersibility is the best, the conductive carbon network will be disconnected, the electronic conductance of the electrode will decrease, the polarization will increase, and therefore the capacity will decrease.
6. References
Kentaro Kuratani, Kaoru Ishibashi, Yoshiyuki Komoda, Ruri Hidema, Hiroshi Suzuki and Hironori Kobayashi1. Controlling of Dispersion State of Particles in Slurry and Electrochemical Properties of Electrodes. Journal of the Electrochemical Society, 166 (4) A501-A506 (2019)
7. Recommended Test Equipment for IEST BSR Series Slurry Resistance analyzer
Updated on Jan. 14, 2025
Subscribe Us
Contact Us
If you are interested in our products and want to know more details, please leave a message here, we will reply you as soon as we can.


