-
iestinstrument

Abstract
1. Introduction: “True Aging” vs. “Just Tired”
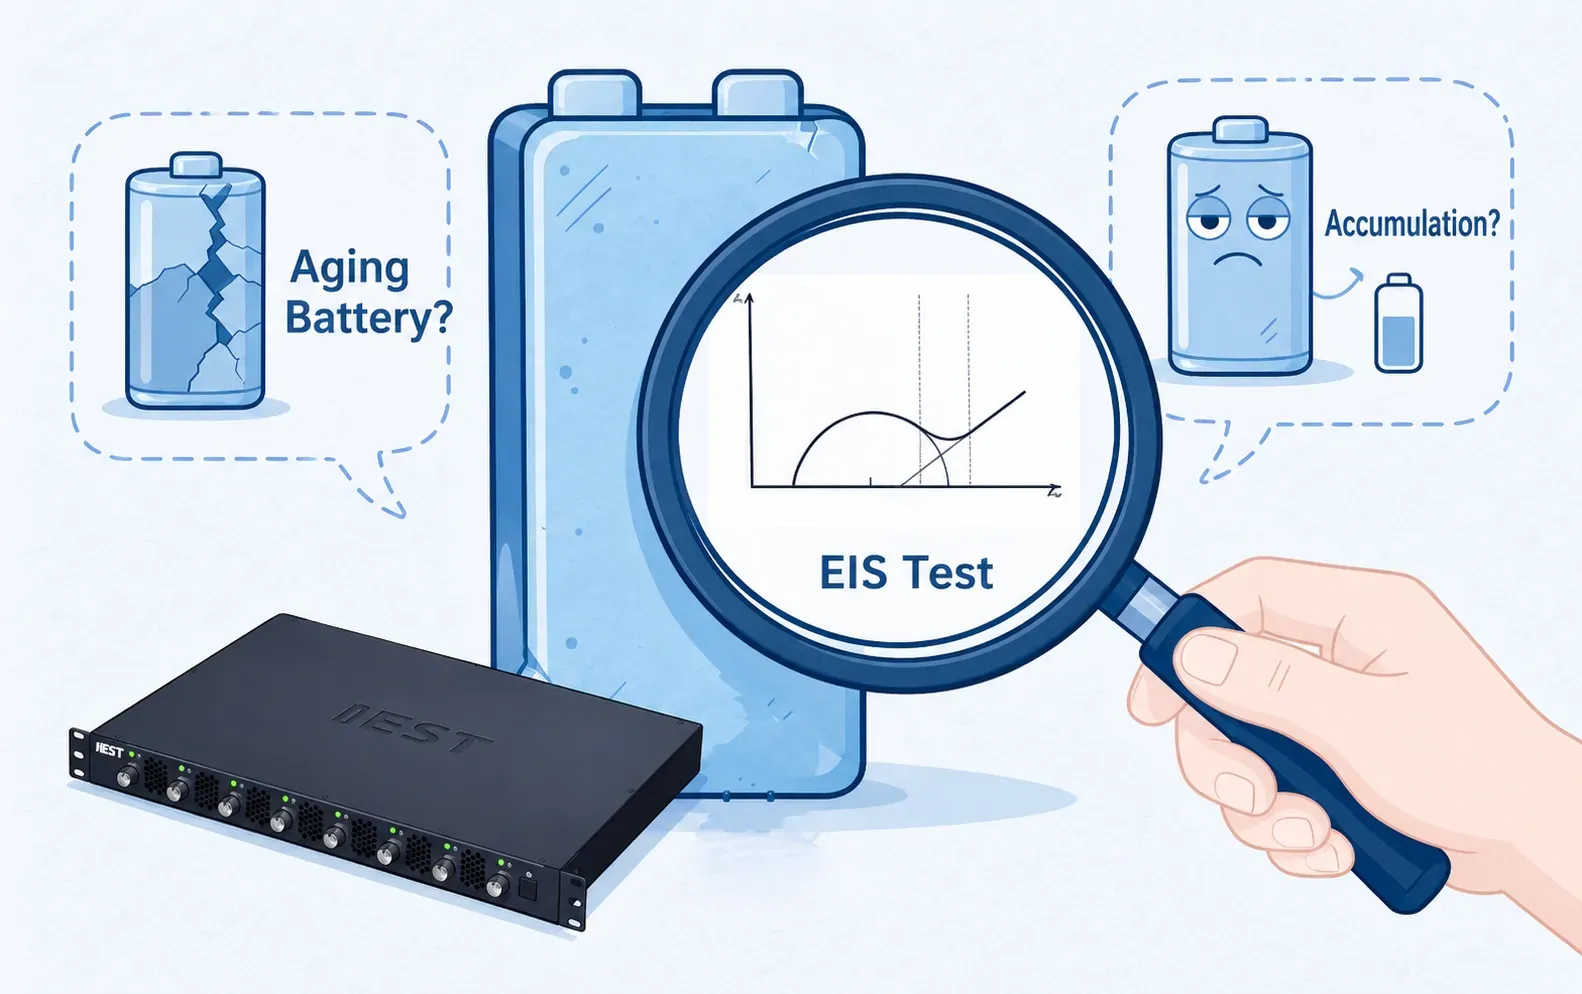
After 600 cycles, a batch of production cells showed a capacity retention of only 65.62%, judged as NG (no-good). The critical question: is it “true aging” (thermodynamic loss of active lithium) or simply “tired” (kinetic loss due to impedance growth)? Electrochemical impedance spectroscopy (EIS) is the most powerful tool to answer this question.
2. The Problem with Conventional “Experience-Based” Methods
There is no standardized EIS failure analysis protocol in the lithium battery industry. Many engineers use an empirical method: charge the cell to 50% SOC, place it in a 0°C low-temperature chamber, and sweep an ultra-wide frequency range. This seemingly reliable approach incurs three “hidden costs”:
- Equipment and time: 0°C testing requires a dedicated low-temperature chamber and at least 2 hours of rest before measurement.
- Long acquisition time: Extending the frequency lower limit to 0.003 Hz takes about 30 minutes per spectrum — three times longer than a 0.01 Hz cutoff.
- Data reliability: Low temperature suppresses electrochemical reactions, causing charge-transfer resistance to skyrocket and dominate the spectrum. The SEI film resistance, which is the actual target of interest, becomes “drowned out,” compromising data reliability.
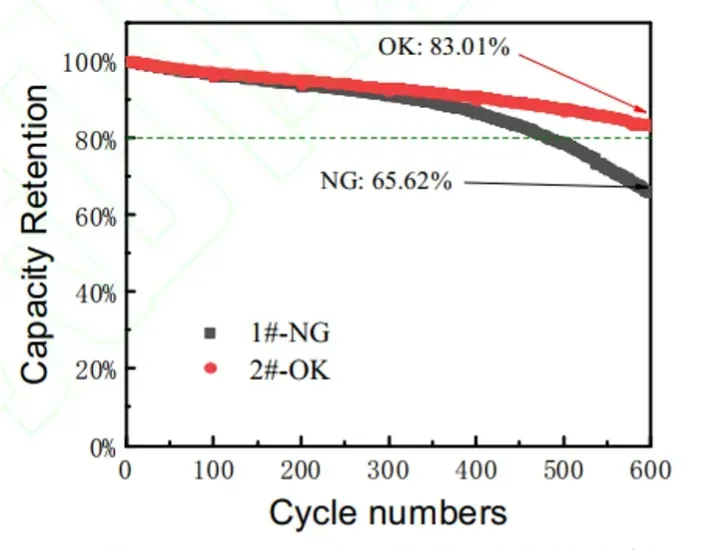
Figure 1. Cycle aging test results for NG and OK batteries.
| Cell Type | Initial Capacity (mAh) |
Low-Current Recovered Capacity (mAh) | Capacity Recovery Rate | Cycle Retention Rate | Irreversible Capacity Loss | Reversible Capacity Loss |
|---|---|---|---|---|---|---|
| OK | 4981.62 | 4376.34 | 87.85% | 83.01% | 12.15% | 4.84% |
| NG | 5001.63 | 4447.97 | 88.93% | 65.62% | 11.07% | 23.31% |
3. What EIS Can Reveal About Lithium-Ion Battery Failure
Electrochemical impedance spectroscopy applies a small AC perturbation around a defined operating state and records the response over a range of frequencies. The resulting impedance spectrum is commonly displayed as a Nyquist plot, where the real component of impedance is plotted against the negative imaginary component. Different frequency regions can be associated with different processes, although the interpretation depends on cell design, electrode configuration, temperature, state of charge, and the equivalent-circuit model.
In the equivalent circuit used in the supplied study figure, the high-frequency response includes the ohmic resistance (R0), the intermediate-frequency response includes an SEI-film resistance contribution (Rf) and a charge-transfer resistance contribution (Rc), and the low-frequency region is represented by a Warburg-type diffusion element (Zw). These assignments are model-dependent. A fitted parameter should be interpreted together with the spectrum, test conditions, and independent evidence.
4. Latest Research Points to the “Optimal Solution”: Room Temperature, Empty State, Optimized Frequency
A 2026 study by Guo Limin’s team at Sunwoda, published in Battery Industry, systematically validated on production pouch cells that:
- Room temperature (25°C) yields results consistent with 0°C testing.
- After the small-current capacity recovery test, the cell is naturally at empty state — no need to recharge to 50% SOC before EIS.
- A frequency cutoff at 0.01 Hz provides sufficient information in about 10 minutes per spectrum without introducing noise from ultra-low frequencies.
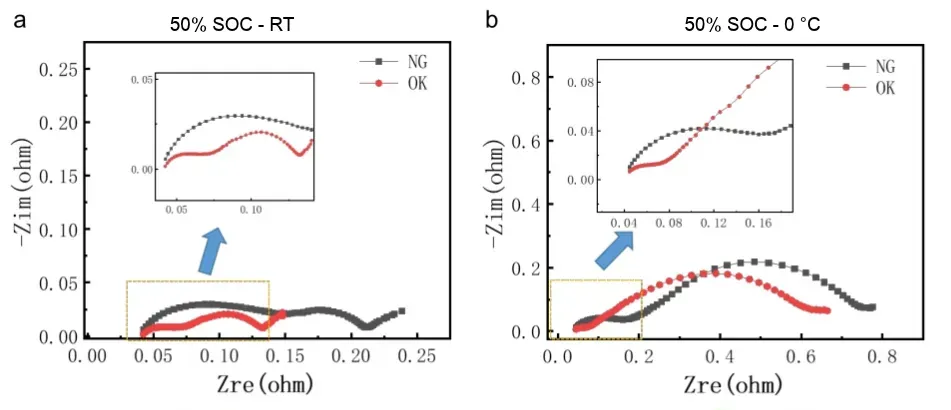
Figure 2. EIS test results for OK and NG batteries at room temperature (25°C) (a) and low temperature (0°C) (b).
Figure 3 presents an equivalent circuit with four assigned contributions: Ro for ohmic resistance, Rf for the SEI-film branch, Rc for charge-transfer behavior, and Zw for diffusion-related impedance. In this model, Rf and Rc are each shown in parallel with a capacitive element, while the Warburg element represents the low-frequency diffusion contribution.
The fitted parameters help organize the NG/OK comparison, but equivalent-circuit fitting is not a unique map of physical reality. Different circuits can sometimes fit similar spectra. Engineers should review residuals, parameter confidence, frequency coverage, and consistency across replicate cells before assigning a physical interpretation to one fitted resistance term.
Test results show that the SEI film resistance of the NG cell is approximately 3× that of the OK cell (100 mΩ vs. 32 mΩ), fully reproducing the 0°C conclusion at room temperature and empty state. SEM observation after disassembly directly revealed micron-scale SEI thickening on the NG anode, mutually corroborating the macroscopic EIS data with microscopic morphology and locking in the “kinetic-loss-type capacity fade” mechanism.
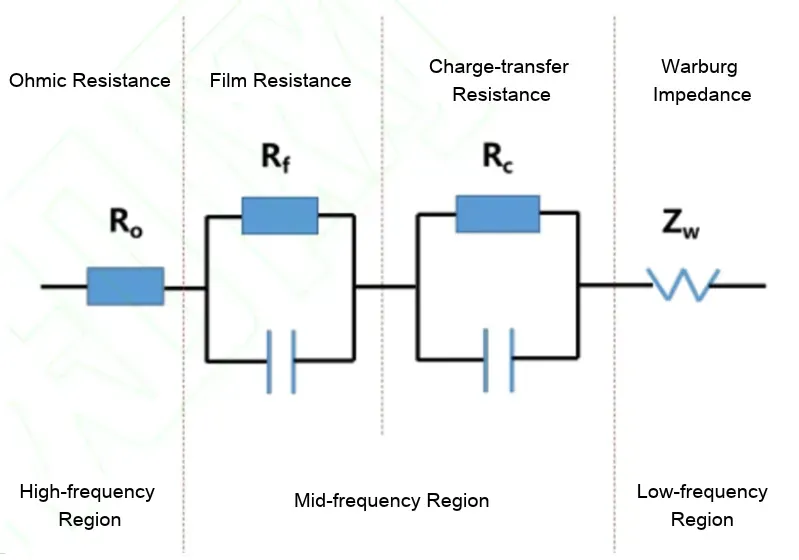
Figure 3. Battery EIS Equivalent Circuit Model (Ro, Rf, Rc, Zw) across Frequency Regions.
| Test Condition | Sample | Ro (mΩ) | Rf (mΩ) | Rc (mΩ) |
|---|---|---|---|---|
| Half-charged (25 °C) | NG | 37 | 100 | 91 |
| OK | 41 | 32 | 60 | |
| Half-charged (0 °C) | NG | 38 | 169 | 679 |
| OK | 34 | 66 | 637 | |
| Discharged (25 °C) | NG | 48 | 77 | 132 |
| OK | 48 | 26 | 76 |
5. IEST ERT7008: Multi-Channel EIS Testing Equipment for Battery Aging Studies
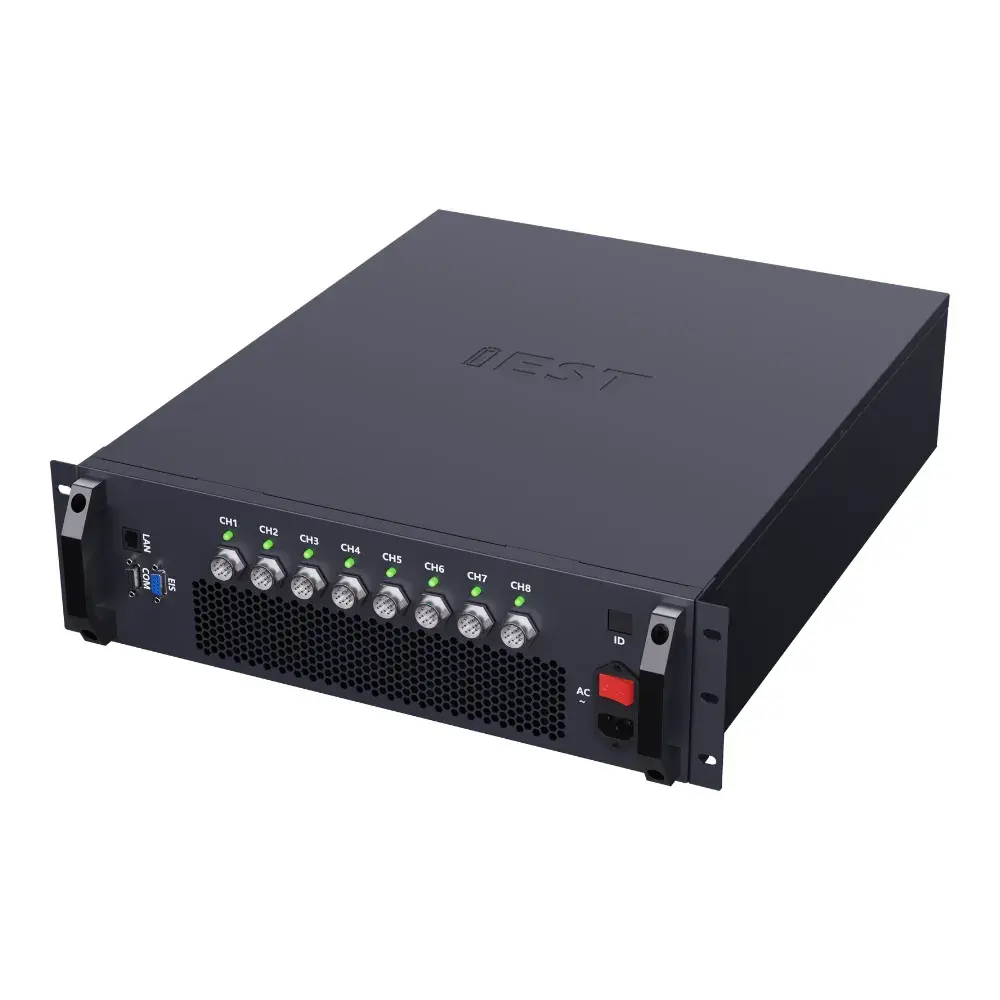
A good method needs a capable testing platform. The IEST ERT7008 electrochemical performance analyzer supports every step of this optimized EIS failure analysis workflow:
- Sufficient frequency range: 0.01 Hz – 100 kHz wide-band coverage meets the needs of 10 mΩ to kΩ-level cells, without wasting time on invalid ultra-low-frequency data.
- Batch parallelism: 8 independent channels operate without interference, enabling side-by-side comparison of NG and OK cells and multiplying failure analysis throughput.
- Complete modes: PEIS/GEIS dual-mode, compatible with coin cells and pouch cells; high-precision measurement ensures data reliability.
- Solid data quality: Deviation from imported electrochemical workstations is less than 5%, while total cost is reduced by approximately 50%. The software includes built-in DRT impedance decomposition for faster identification of SEI film resistance anomalies.
Alongside EIS, the ERT series supports electrochemical techniques including cyclic voltammetry (CV), linear sweep voltammetry (LSV), GITT, PITT, chronoamperometry (CA), and chronopotentiometry (CP).
| Model | ERT7008 (High-Precision Cyclic Voltammetry Testing System + 100 kHz EIS) | ||
|---|---|---|---|
| Product Appearance | 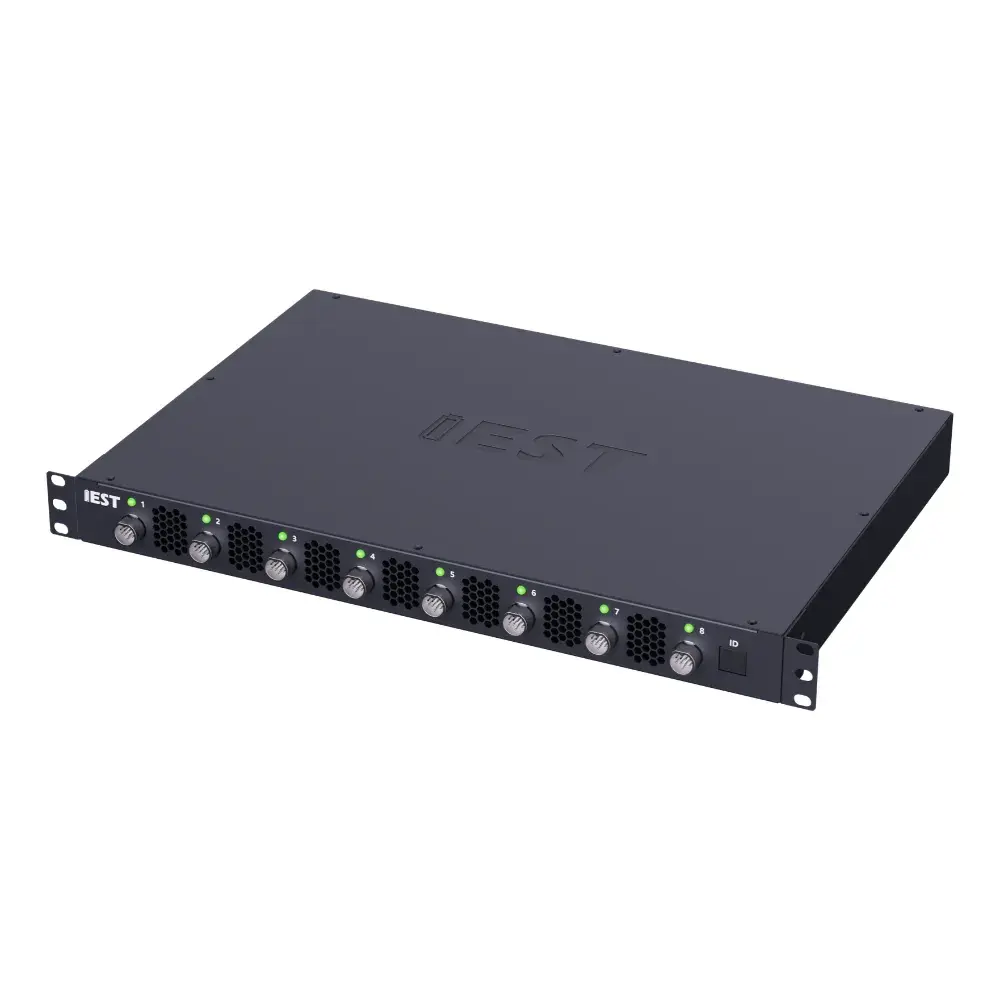 |
 |
|
| Specification | ERT7008-5V100mA | ERT7008-5V6A | ERT7008-5V12A |
| Voltage Range | −5 V ~ 5 V | −5 V ~ 5 V | 0 V ~ 5 V |
| Current Range | ① 100 mA ~ 10 mA ② 10 mA ~ 1 mA ③ 1 mA ~ 0.1 mA ④ 0.1 mA ~ 10 nA (Auto-switching across 4 ranges) |
① 6 A ~ 600 mA ② 600 mA ~ 60 mA ③ 60 mA ~ 6 mA ④ 6 mA ~ 0.6 μA (Auto-switching across 4 ranges) |
① 12 A ~ 1.2 A ② 1.2 A ~ 120 mA ③ 120 mA ~ 12 mA ④ 12 mA ~ 1.2 μA (Auto-switching across 4 ranges) |
| ★ High-Frequency Impedance Test ★ | High-Frequency Impedance (EIS): 100 kHz ~ 0.001 Hz | ||
| ★ Impedance Test Mode ★ | Supports both static EIS and dynamic EIS testing | ||
| ★ Electrochemical Testing ★ | Cyclic Voltammetry (CV), Linear Sweep Voltammetry (LSV), GITT / PITT / CA / CP | ||
| Optional Temperature Chamber | Standard 10 ~ 100 °C (other temperature ranges customizable), supports chamber linkage control | ||
| Number of Channels | 8 | ||
| Input Interface | 4-electrode aviation plug (supports 3-electrode testing when paired with auxiliary voltage) | ||
| Voltage & Current Accuracy | ±0.01% F.S. (Full Scale) | ||
| Voltage & Current Resolution | 5 significant digits (automatic) | ||
| Input Power | 50 W | 350 W | 600 W |
| Operating Modes | • Charge/Discharge Modes: Constant Current (CC), Constant Voltage (CV), CC-CV, Constant Power (CP), Constant Resistance (CR), DCIR, Rate Charge/Discharge, etc. • Electrochemical Modes: High-Frequency Impedance (EIS), Cyclic Voltammetry (CV), Linear Sweep Voltammetry (LSV), Galvanostatic Intermittent Titration Technique (GITT), Potentiostatic Intermittent Titration Technique (PITT), Chronoamperometry (CA), Chronopotentiometry (CP), etc. |
||
6. Conclusion
From “experience-based” to standardized, and from imported monopolies to cost-effective domestic solutions, EIS failure analysis is becoming faster, cheaper, and more accurate. By adopting room-temperature, empty-state testing with an optimized frequency range down to 0.01 Hz, and using the IEST ERT7008 multi-channel analyzer, engineers can reliably diagnose battery capacity fade mechanisms — particularly SEI film resistance increases — without the time and cost penalties of conventional low-temperature methods.
Accelerate Battery Failure Analysis with IEST ERT7008
The IEST ERT7008 8-channel electrochemical analyzer delivers high-precision EIS (100 kHz–0.01 Hz), integrated DRT analysis, and cost-effective multi-channel testing — enabling faster, more accurate diagnosis of SEI film resistance and capacity fade mechanisms in lithium-ion batteries.
7. References
[1] GUO Limin, et al. Study on Electrochemical Impedance Spectroscopy Testing Methods for Capacity Fading Failure Analysis in Lithium-ion Batteries. Battery Industry, 2026.
8. FAQs
How to perform EIS failure analysis on lithium-ion batteries?
Perform EIS failure analysis at room temperature (~25°C) and empty state of charge after a capacity recovery test. Use a frequency range down to 0.01 Hz, which takes about 10 minutes per spectrum. This avoids low-temperature chambers and long rest times while reliably separating SEI film resistance from charge-transfer resistance.
Is room-temperature EIS reliable compared with low-temperature EIS for battery aging?
In the cited commercial pouch-cell case, the NG/OK diagnostic trend observed at 25 °C was consistent with the 0 °C comparison. Low temperature increased the fitted charge-transfer contribution, which could make the SEI-film contribution less distinct. This result supports room-temperature testing for that failure case, but other chemistries and aging mechanisms may require temperature-specific validation.
What is the optimal EIS frequency range for battery failure analysis?
There is no single optimal frequency range for every battery. In the reported case, a 0.01 Hz lower limit provided sufficient information for the NG/OK comparison, with about 10 minutes per spectrum; extending the lower limit to 0.003 Hz took about 30 minutes. The upper and lower limits should be selected according to the cell time constants, diagnostic objective and data quality requirements.
What is the difference between kinetic and thermodynamic capacity loss?
Kinetic loss refers to capacity fade caused by increased impedance (e.g., SEI growth, charge-transfer resistance rise), which can be partially recovered at low currents. Thermodynamic loss refers to irreversible loss of active lithium inventory, which cannot be recovered. EIS distinguishes these by quantifying SEI and charge-transfer resistances.
What is the difference between room-temperature EIS and low-temperature EIS for battery aging?
Room-temperature EIS (25°C) produces results consistent with low-temperature (0°C) testing for SEI resistance diagnosis but eliminates the need for a low-temperature chamber and long rest periods. At 0°C, charge-transfer resistance dominates and masks SEI film resistance, reducing data reliability. Room-temperature EIS avoids this masking effect and reduces testing time by about 3×.