-
iestinstrument

Abstract
1. Introduction
During charge and discharge, lithium-ion battery electrode active materials undergo volume changes as lithium ions intercalate and de-intercalate. These microscopic volume changes manifest as macroscopic swelling force at the cell level. The spatial distribution and evolution of swelling force directly affect structural integrity, cycle life, and safety. The NCM cathode and graphite anode system combines high energy density with mature manufacturing processes, making it a mainstream choice for power and energy storage batteries. However, this system exhibits significant mechano-electrochemical coupling behavior during cycling. As charge-discharge rates increase, this coupling effect may intensify, significantly impacting internal stress response and pressure distribution. Therefore, systematic research on the stress response and pressure distribution of NCM graphite cells at different charge-discharge rates holds important theoretical and engineering value.
2. Experimental Setup and Methods
2.1 Equipment
Tests were performed using the IEST SWE3500 in-situ swelling testing system and the IEST BPD1100 pressure mapping distribution system (Figure 1). The BPD1100 film is placed flat inside the SWE3500 test chamber, with the cell positioned on top of the film. The system operates in constant gap mode with an initial preload of 108 kg, enabling in-situ monitoring of both swelling force curves and surface pressure distribution during cycling.
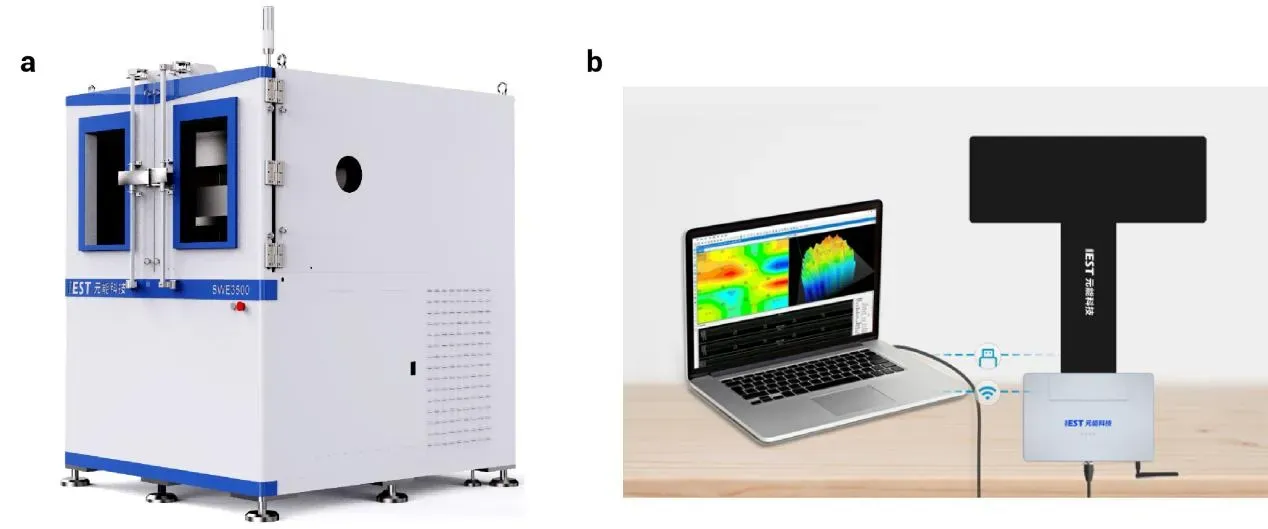
Figure 1. Test equipment: (a) IEST SWE3500 in-situ cell swelling test system; (b) BPD1100 pressure distribution film and data-acquisition setup.
2.2 Test Cell
NCM cathode / graphite anode (Gr|NCM) pouch cell.
2.3 Test Protocol
Voltage window: 2.75–4.2 V. Cycling rates: 0.5C, 1C, and 1.5C, with 3 cycles conducted at each rate.
3. Results and Analysis
3.1 Multi-Peak Swelling Force Behavior
NCM ternary materials exhibit multi-peak characteristics in their swelling force curves during charge and discharge (Figure 2). This phenomenon is closely related to Li⁺ intercalation/de-intercalation behavior in the layered structure. Li⁺ insertion and extraction alter the screening effect on interlayer Coulomb repulsion, inducing changes in oxygen layer repulsion forces. Additionally, excessive delithiation causes crystal structure slip along the direction perpendicular to the c-axis, changing the interlayer spacing. These two mechanisms work synergistically to produce multiple swelling force peaks.
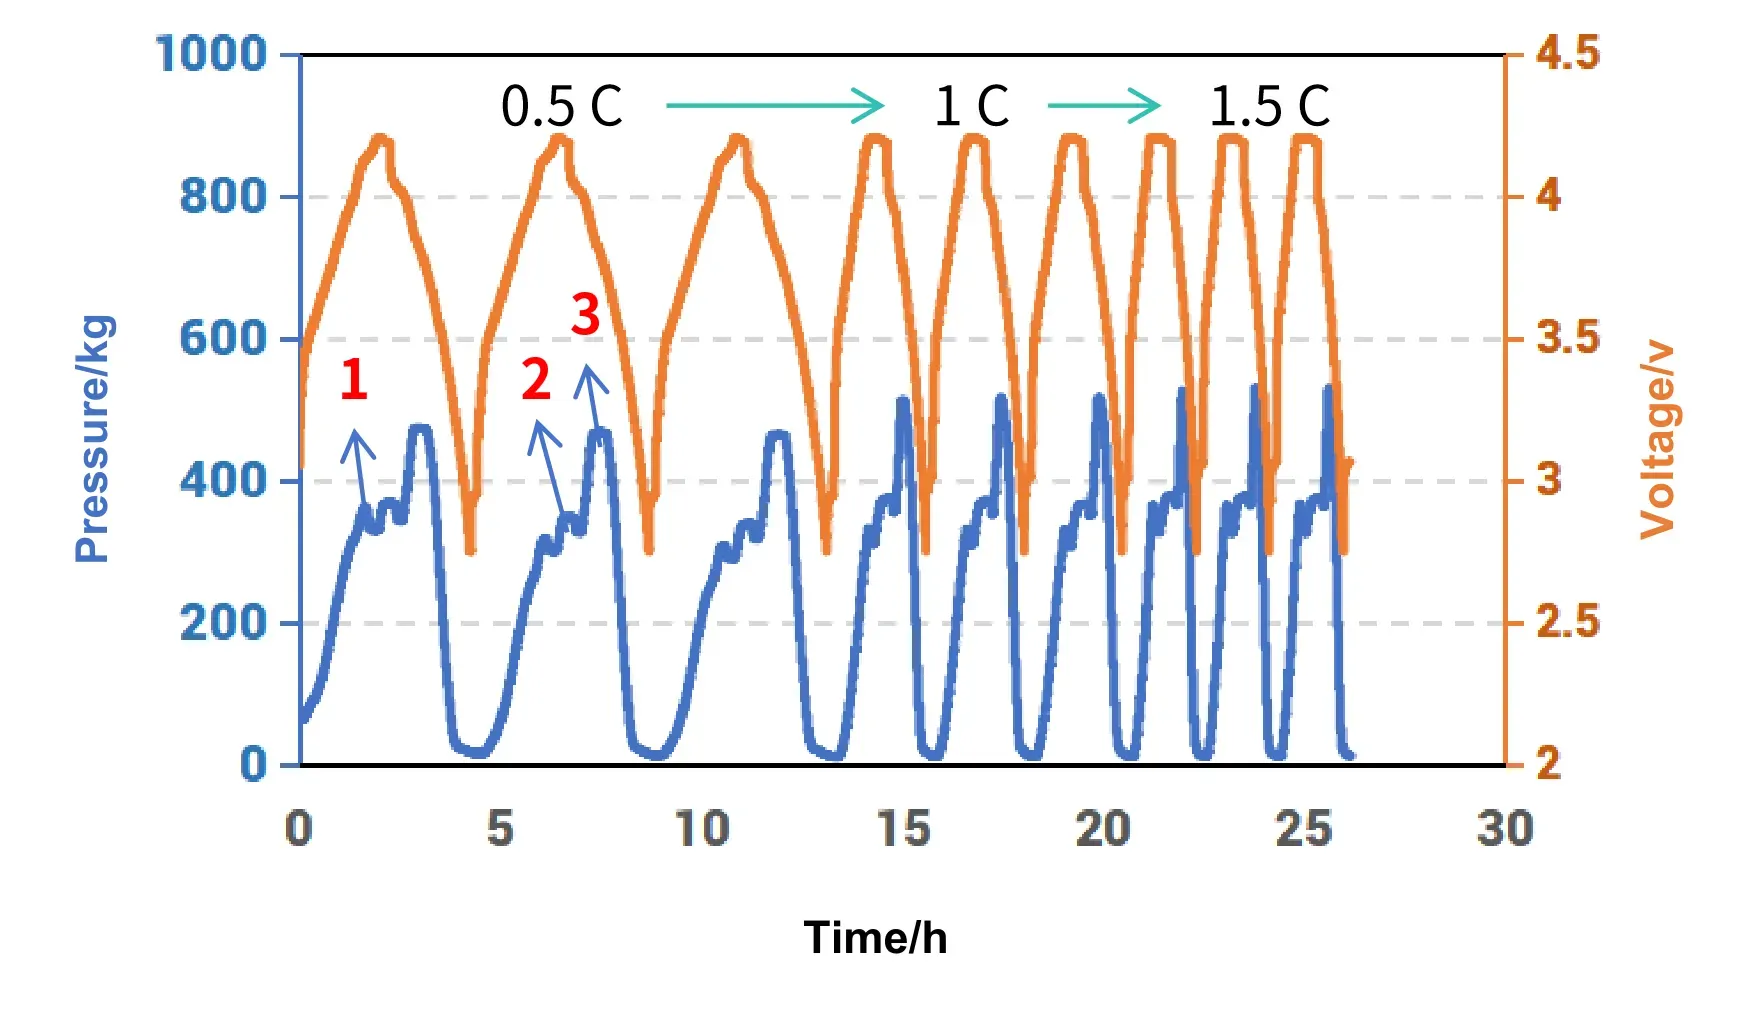
Figure 2. Charge-discharge voltage and swelling force signals under constant gap mode at different C-rates.
3.2 Effect of C-Rate on Swelling Force Peaks
As shown in Table 1, with increasing charge rate, polarization causes the potential at which swelling force Peak 1 occurs to gradually increase, and the corresponding swelling force value also increases (Figure 3). During full-charge rest, internal stress within the cell redistributes, and the swelling force signal changes significantly within the relatively flat voltage region, forming swelling force Peak 2. During the subsequent discharge, the combined effects of Li⁺ intercalation-induced interlayer spacing increase and the Li⁺ screening effect cause the swelling force signal to macroscopically manifest as Peak 3, whose corresponding potential gradually decreases with increasing discharge rate. Under high-rate operating conditions, the potential signal is the electrochemical manifestation that most intuitively reflects intensified polarization, whereas the swelling force signal superimposes multiple factors induced by increasing charge-discharge rate, including lattice changes, gas evolution, and thermal expansion. This is of significant importance for in-depth analysis of cell failure mechanisms under high-rate charge-discharge conditions.
| Swelling Force Peak | 0.5 C | 1 C | 1.5 C |
|---|---|---|---|
| Force peak 1 | C 4.1239 V | C 4.1936 V | C 4.1992 V |
| Force peak 2 | Rest 4.1859 V | Rest 4.1858 V | Rest 4.1859 V |
| Force peak 3 | D 3.8599 V | D 3.7636 V | D 3.689 V |
Further analysis of the correlation between peak swelling forces and charge/discharge C-rates (Figure 3) reveals that the magnitude of swelling force Peak 1 exhibits a strong linear dependence on the C-rate. Additionally, during the cell rest period, the potential signal corresponding to swelling force Peak 2 remains virtually unchanged; nevertheless, a slight, highly linear increase in the swelling force response is still observed with escalating C-rates. However, as the C-rate continues to increase, this linear relationship between swelling force and C-rate diminishes. This demonstrates that within a defined C-rate regime, peak swelling force signals can be effectively leveraged to predict and track the bulk structural evolution of the battery under diverse operating rate conditions.
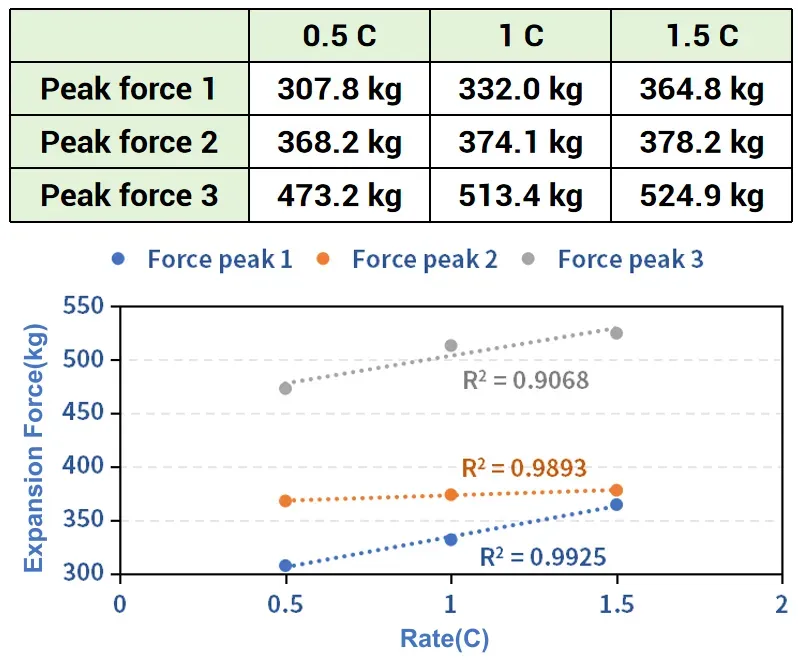
Figure 3. Reported peak-force values and their relationship with C-rate; the linear fit is strongest for force peak 1 and weaker for force peak 3.
3.3 Spatial Pressure Distribution Inhomogeneity
The internal stress distribution within NCM/graphite cells exhibits pronounced spatial heterogeneity and distinct dynamic evolution characteristics (Figures 4–6). Pressure distribution contour maps captured at peak swelling forces across various C-rates and at the 4.2 V fully charged state clearly reveal that escalating charge/discharge rates drastically aggravate the spatial non-uniformity of Li⁺ intercalation and deintercalation within the active particles. Integrated with tactile pressure mapping films, this approach intuitively visualizes the surface pressure discrepancies across the cell.
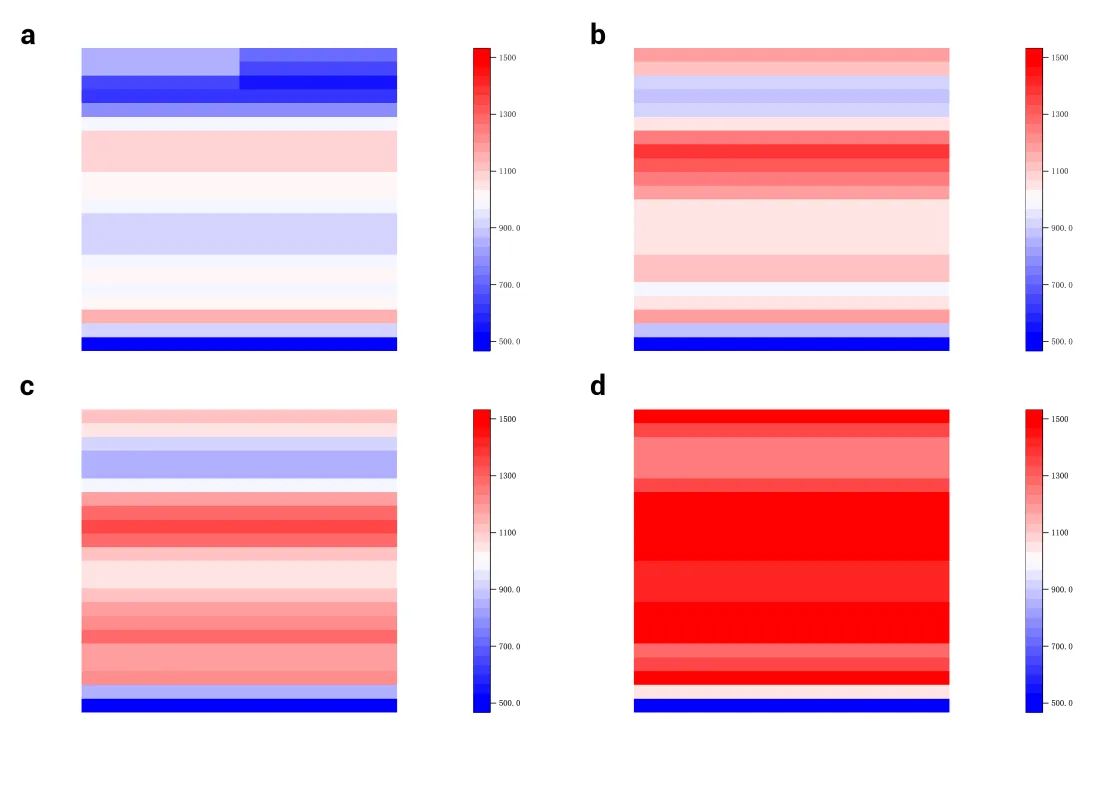
Figure 4. Pressure distribution at 0.5C: (a) first peak force, (b) full charge, (c) second peak, (d) third peak.
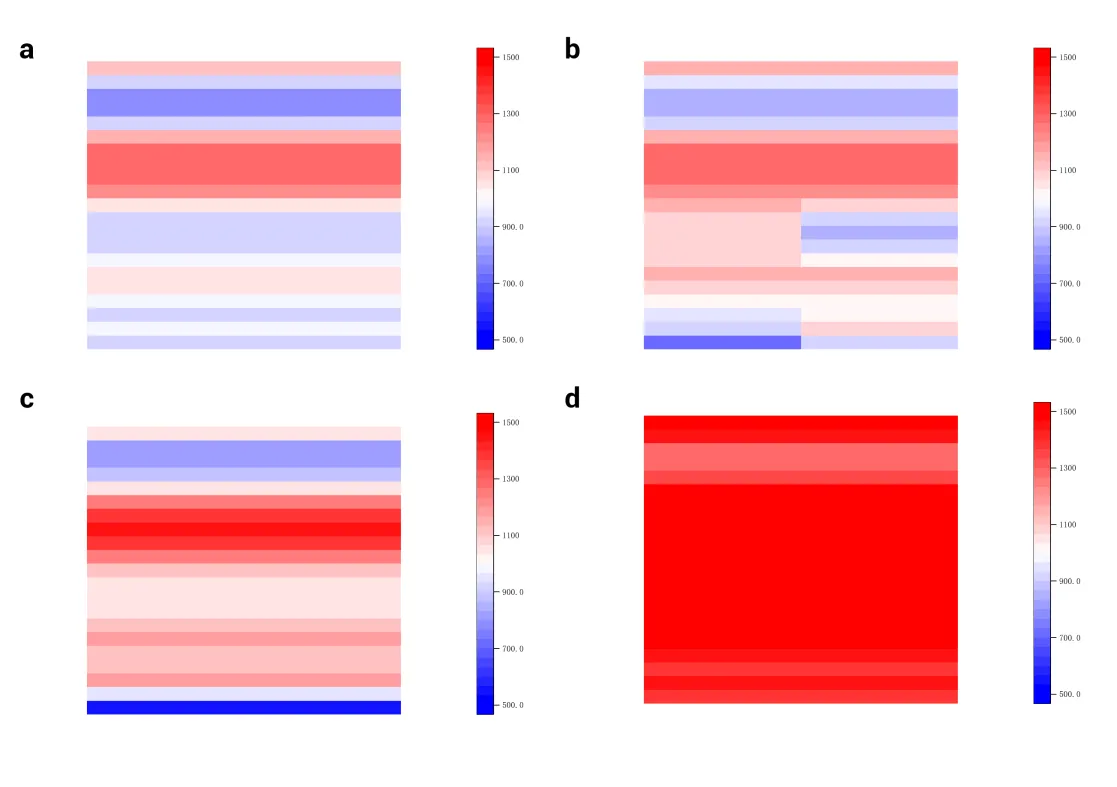
Figure 5. Pressure distribution at 1C: (a) first peak force, (b) full charge, (c) second peak, (d) third peak.
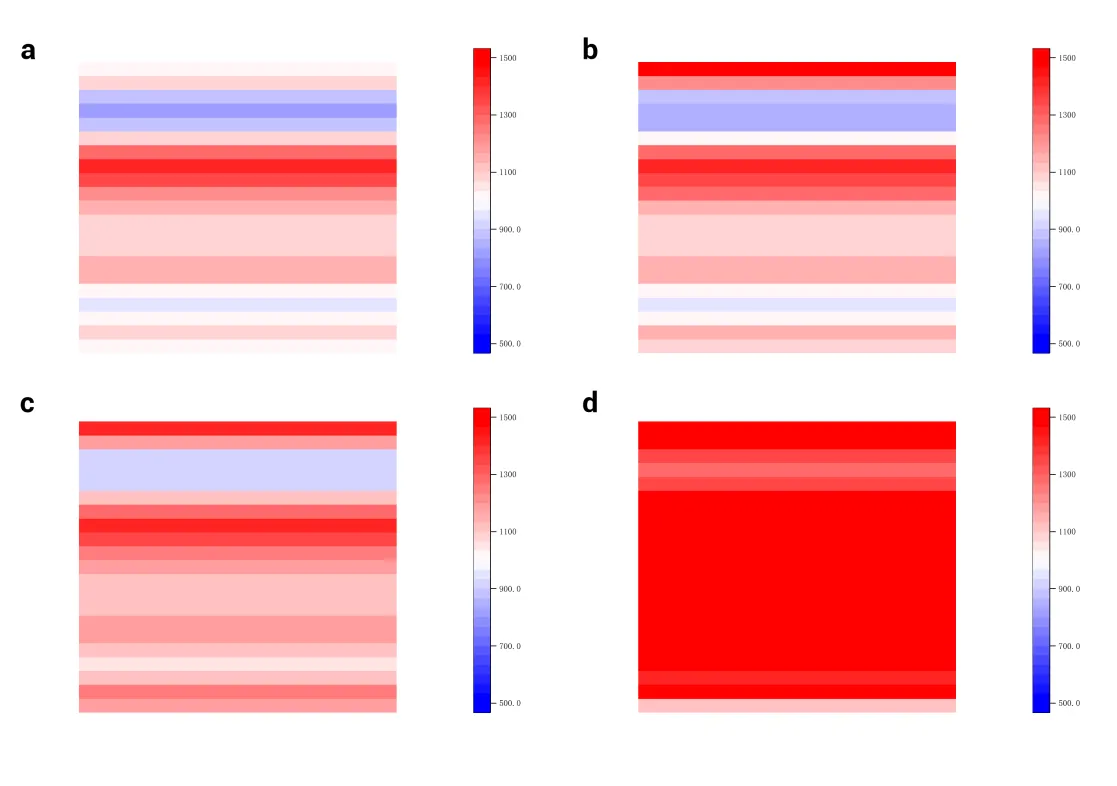
Figure 6. Pressure distribution at 1.5C: (a) first peak force, (b) full charge, (c) second peak, (d) third peak.
4. Engineering Implications for Charging Strategy and Module Design
Characterizing the mechanical response and pressure distribution of NCM/graphite cells at different C-rates has practical value for charge–discharge strategy development, cell-structure optimization and safety assessment:
- For charging strategy: The observed relationship between C-rate and swelling-force response provides mechanical evidence that can support the evaluation of rate-dependent behavior and help identify force signals associated with changes in the cell’s bulk structure.
- For cell and module design: The spatial non-uniformity of surface pressure indicates that mechanical constraint design should consider differences between central and edge regions instead of assuming a uniform pressure field.
Combining an in-situ swelling-force curve with spatial pressure mapping provides complementary mechanical information: the force curve tracks the overall response over time, while the pressure maps show where the cell-surface pressure is distributed unevenly.
5. Conclusions
This study systematically investigates the stress response and pressure distribution of NCM graphite cells at different charge-discharge rates. Key findings include:
- Swelling force curves exhibit multiple peaks corresponding to Li⁺ intercalation/de-intercalation phase transitions and structural changes.
- Peak force values increase linearly with C-rate (R² > 0.99 for Peak 1), providing a mechanical basis for fast-charging boundary setting.
- Spatial pressure distribution becomes increasingly inhomogeneous at higher C-rates, requiring differentiated constraint designs in battery module structural optimization.
These results offer valuable engineering guidance for charging strategy development, module structural design, and safety early warning systems. The IEST SWE3500 and BPD1100 provide reliable in-situ characterization tools for these critical mechanical measurements.
Quantify Cell Swelling and Pressure Distribution with IEST
The IEST SWE3500 in-situ expansion tester and BPD1100 pressure distribution film enable precise, synchronized measurement of swelling force and spatial pressure mapping under realistic operating conditions. Optimize your fast-charging strategy and module design with data-driven mechanical characterization.
6. References
[1] Maddipatla, S.; Rauf, H.; Osterman, M.; Arshad, N.; Pecht, M. Swelling Mechanisms, Diagnostic Applications, and Mitigation Strategies in Lithium-Ion Batteries. Batteries 2025, 11, 356.
[2] Cao, Y.; Wang, H.; Liu, B. Multi-scale swelling behaviors and mechanisms of graphite electrode-based lithium-ion battery at various charging rates. Journal of Power Sources 2024, 606, 234504.
7. FAQs
Why do NCM/graphite battery cells exhibit multiple swelling force peaks during cycling?
Swelling force peaks arise from coupled phase transitions and lattice dynamics in layered NCM cathodes during delithiation. The extraction of lithium ions alters Coulombic repulsion screening between oxygen layers. At higher states of charge, structural lattice contraction and slip along the c-axis induce dynamic stress variations, resulting in characteristic multi-peak profiles.
How does charging C-rate affect battery swelling force?
Higher C-rates intensify electrochemical polarization and accelerate lithium concentration gradients across electrodes, significantly elevating peak swelling forces. Under constant-gap testing, peak force 1 displays a strong linear correlation with C-rate (R² = 0.9925), providing a quantitative mechanical benchmark for establishing safe fast-charging limits.
Why is pressure distribution inhomogeneity important under fast charging?
Pressure distribution inhomogeneity reflects spatial variations in lithium intercalation and stress accumulation. Under fast charging, non-uniform pressure can lead to localized overcharge, accelerated degradation, and safety risks. In-situ pressure mapping with the IEST BPD1100 reveals these spatial differences, enabling engineers to design module constraints that account for center-to-edge variations.
How does pressure mapping data guide battery module structural design?
Battery pressure mapping system demonstrates that cells do not exert a uniform pressure field against module walls. Recognizing localized stress hotspots prevents structural housing deformation, informs compliant buffer pad placement, and mitigates localized lithium plating caused by excessive local compression.
How do in-situ swelling testers and pressure distribution films work together?
The in-situ swelling tester (such as the IEST SWE series) maintains defined mechanical boundary conditions (e.g., constant gap with precise preload) and logs total swelling force over time, while the pressure mapping sensor film (IEST BPD series) maps 2D spatial stress evolution across the active cell face simultaneously.