-
iestinstrument

Abstract
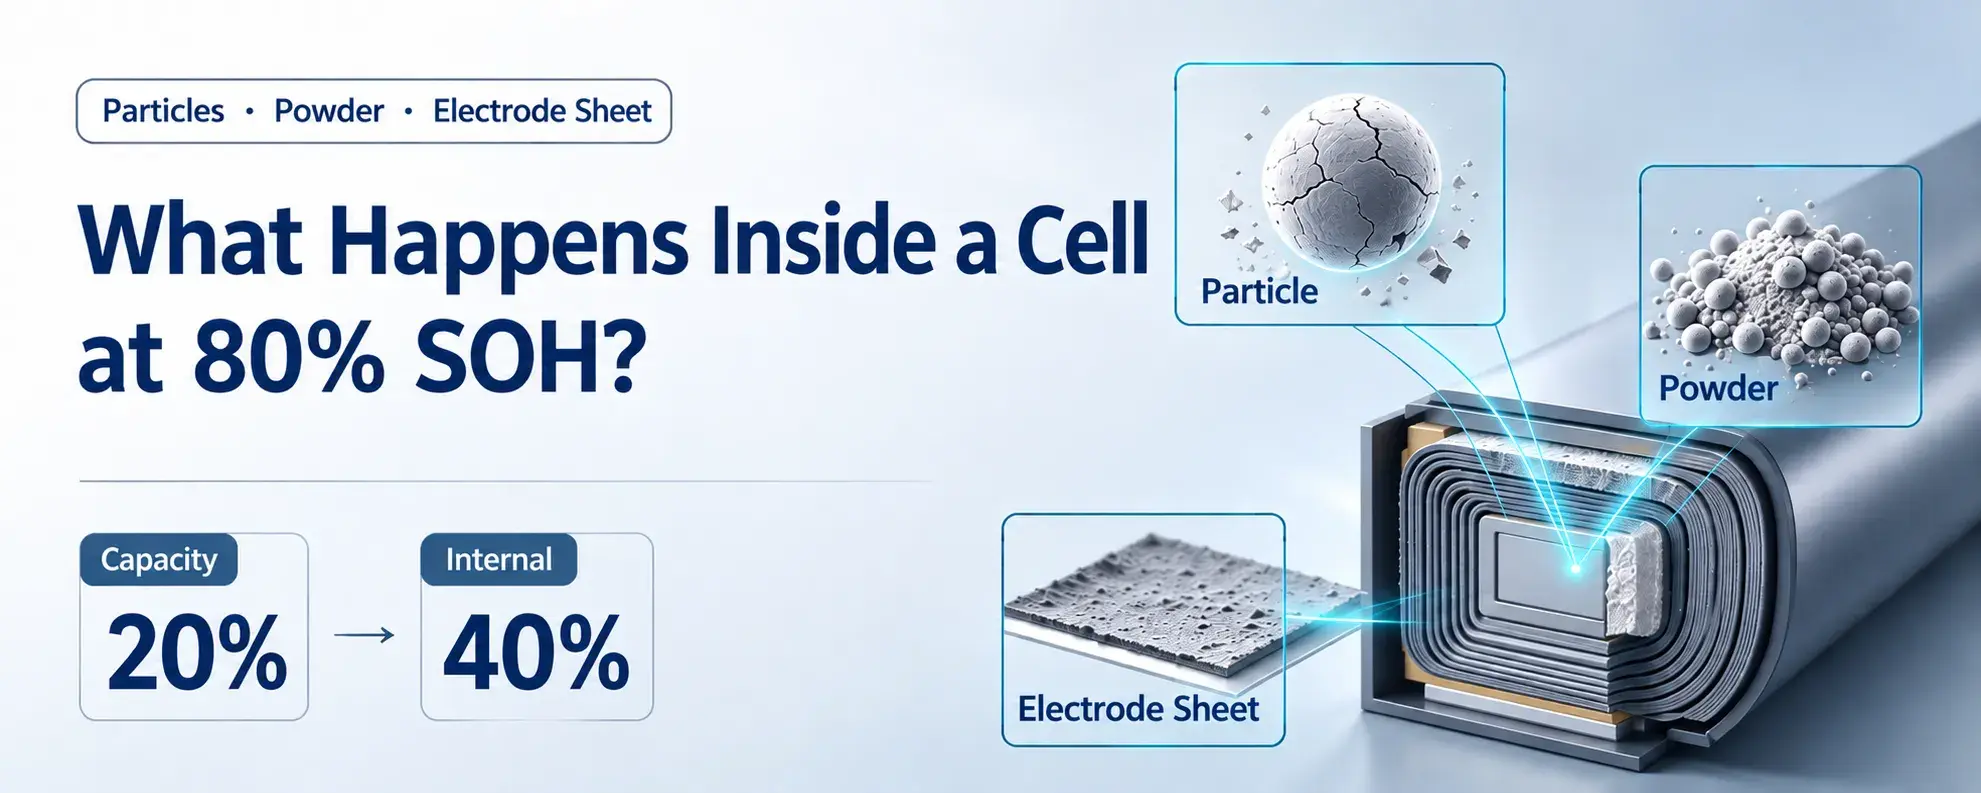
Battery SOH (State of Health) is a result indicator — it tells you how much capacity remains, but not why it declined or what failure mechanism dominates. A cell at 80% SOH may look “only 20% worse” on a capacity tester, yet internally it can be experiencing severe particle cracking, powder compaction failure, and conductive network collapse. This study uses the IEST SPFT2000 single-particle tester, IEST PCD2000 powder compaction density tester, and IEST BER2500 electrode resistivity tester to reveal the multi-scale truth: particle crushing strength drops 39.7%, powder irreversible deformation increases nearly 5×, and electrode resistivity nearly doubles — all while SOH shows only a 20% capacity loss.
1. Introduction: SOH Is a “Retouched ID Photo”
If you hold two NCM ternary cells of the same model — one at 100% SOH and one at 80% SOH — the capacity tester shows only a 20% difference. But the capacity figure does not describe the condition of every component inside the cell. That 20% number is gentle. It is like a retouched ID photo: blemishes smoothed, complexion brightened, looking only “slightly tired.”
But disassemble these two cells, scrape off the cathode powder, press individual particles one by one, compress the powder megapascal by megapascal, and measure the electrode resistivity grid by grid — and you will see a completely different set of numbers:
- Particle crushing strength: decreased by 39.7%
- Powder irreversible deformation: increased from 1.03% to 5.02% — nearly 5×
- Electrode resistivity: increased from 94.75 Ω·cm to 181.32 Ω·cm — nearly doubled
The comparison is a practical example of multi-scale characterization of battery degradation: particle mechanics, powder packing response, and electrode-level electrical properties do not necessarily deteriorate at the same rate. The data support a more detailed investigation of the mechanisms behind capacity fade; they do not, by themselves, establish the remaining useful life of a cell.
2. SOH Is a “Result Indicator,” Not a Diagnosis
SOH is one of the most commonly used health metrics in the battery industry, typically calculated as the ratio of remaining capacity to nominal capacity. SOH is like a thermometer reading: it tells you the fever is 38°C, but not whether it is a cold, an inflammation, or something else. The fever is the same; the disease is entirely different — and so is the treatment.
Two cells at 80% SOH may be experiencing completely different internal stories — one might be active particle pulverization, the other interface failure. Focusing only on SOH cannot reveal these differences. It flattens all different causes into a single number.
To determine where a cell is “sick” and how long it can still serve, SOH alone is insufficient — you need to go one layer deeper, examining the particle, powder, and electrode scales separately.
3. The Truth at Three Scales
Test objects: Same-model NCM ternary cells, one at 100% SOH and one at 80% SOH. After cycling to different health states, cells were disassembled in a dry room, and cathode surface powder was collected for testing.
3.1 Scale One: How Does Cathode Particle Crushing Strength Change at 80% SOH?
The particle-scale test used the IEST SPFT2000 Single Particle Mechanical Properties Test System in displacement-control mode to compress individual cathode particles. This type of measurement focuses on the mechanical response of an individual particle rather than averaging the response across an entire electrode coating.
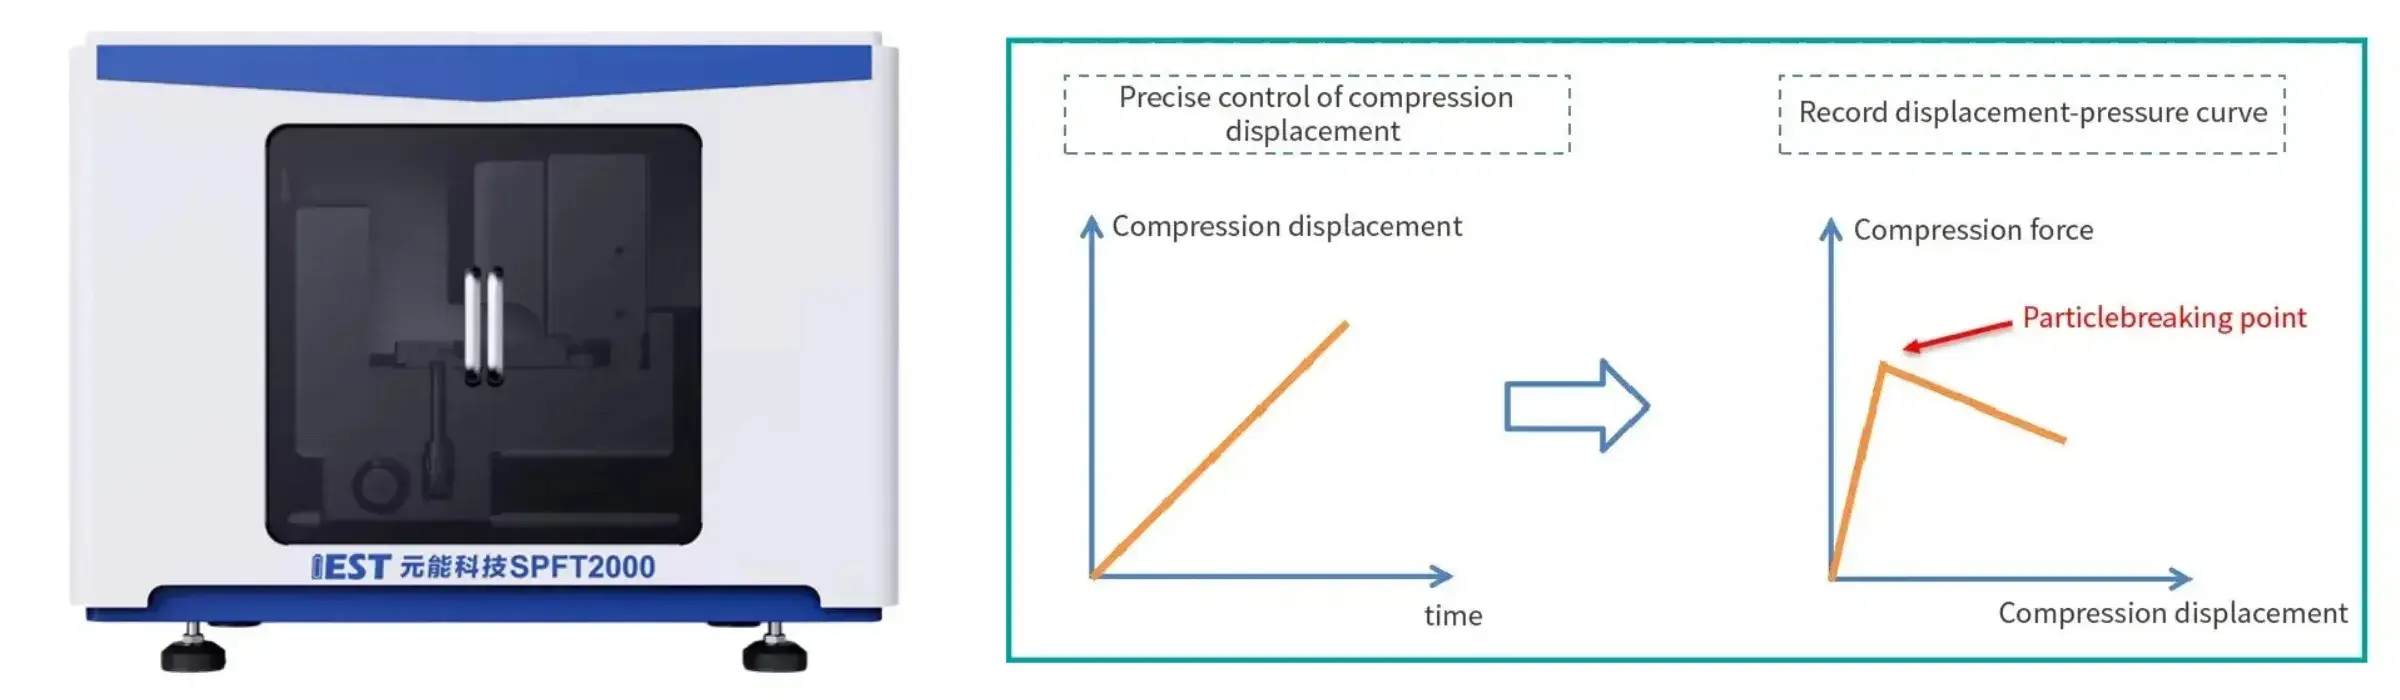
Figure 1. IEST SPFT2000 Single Particle Force Tester and compression-displacement test principle.
The results are direct: cathode particle crushing strength decreased by 39.7%. More visually striking is the morphology after crushing — 100% SOH particles retain an irregular block-like integrity with minimal pulverization; 80% SOH particles exhibit severe powderization (Figure 3 and Figure 4). This morphological difference reveals that aged particles have already been fragmented by internal micro-cracks — before compression, they are no longer a “complete” particle.
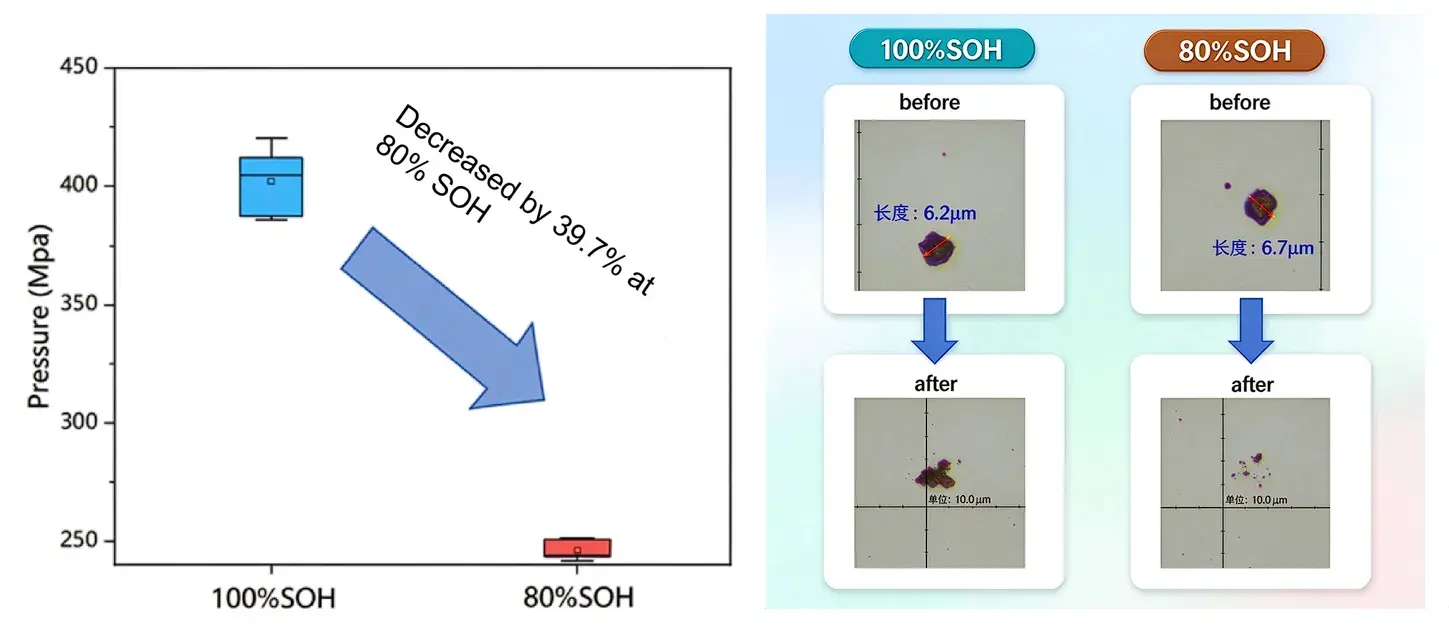
During charge and discharge, the lattice volume change from Li⁺ intercalation and de-intercalation is anisotropic. Especially at high delithiation states, particles repeatedly “breathe” thousands of times, stress concentrates and releases at grain boundaries, first forming intergranular cracks, then intragranular cracks — and particle strength declines continuously[1]. Fresh particles are “dense, complete, load-bearing”; aged particles are filled with micro-cracks and crush more easily. The 39.7% strength decay quantifies this “brittle bones” condition.
Single-particle mechanical testing for aged NCM cathodes can help quantify how resistance to mechanical failure changes between samples. A force-displacement curve provides more information than a single label such as “strong” or “weak”: it can show the loading response and the point at which a particle collapses under the specified conditions.
3.2 Scale Two: What Does Powder Compaction Reveal About Battery Aging?
Powder testing asks a different question from single-particle testing. Instead of measuring one particle’s resistance to fracture, it measures how a bed of particles compresses, rearranges, and recovers when the load is released. Multiple studies confirm a significant positive correlation between the elastic recovery capability of electrode powder materials and battery cycle life: better elastic deformation capability means stress redistribution can alleviate stress concentration within particles, reduce irreversible structural damage, and maintain electrode structural integrity after multiple cycles. Therefore, after measuring “can it be compressed,” we must also answer “can it spring back” — deformation rate and reversible deformation rate are both a ruler for assessing powder aging and a lever for optimizing electrode material design.
Testing used the IEST PCD2000 powder compaction density tester in steady-state pressure relief mode: stepped pressure was applied to the cathode powder, thickness changes were recorded, and elastic deformation (reversible) was distinguished from plastic deformation (irreversible). The powder compression results at different SOH are shown in Table 1.
| Deformation Parameter | 100% SOH | 80% SOH |
|---|---|---|
| Irreversible deformation | 1.03% | 5.02% |
| Maximum deformation | 21.86% | 28.74% |
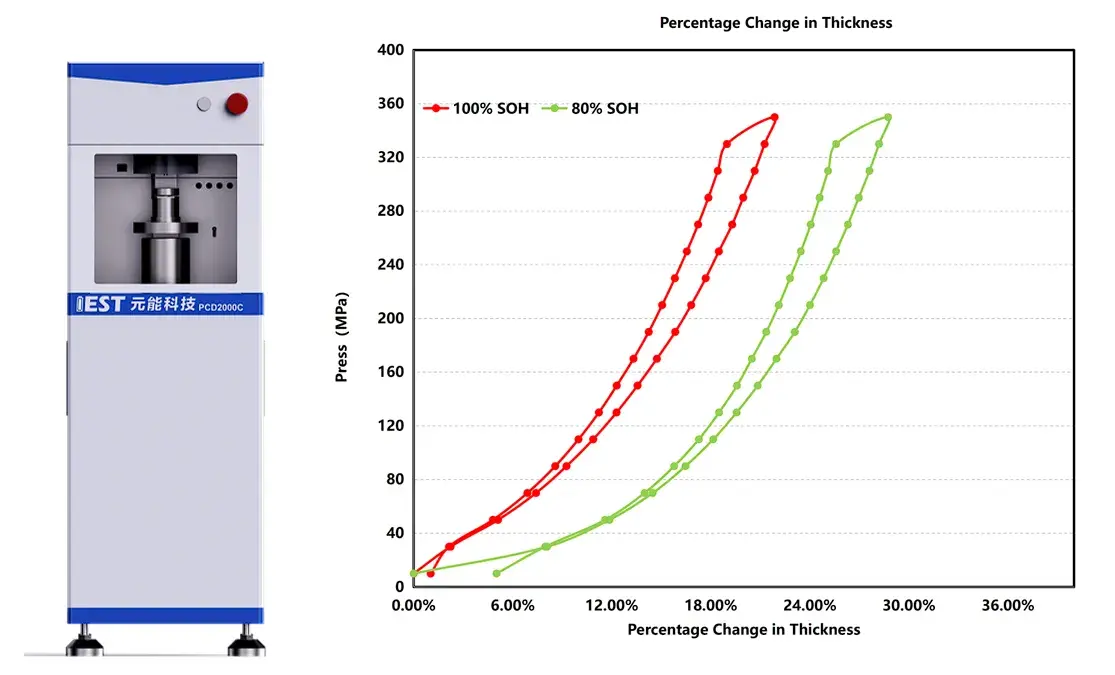
Figure 3. IEST PCD2000 powder compaction density tester and compression deformation curves of cathode powder at different SOH level.
Fresh powder: particles are dense and complete; compression mainly produces elastic deformation plus minor rearrangement, most of which springs back after unloading — irreversible deformation is only 1.03%.
Aged powder: particles are filled with micro-cracks and mixed with loose fragments; compression causes direct collapse, fracture, and rearrangement that cannot spring back after unloading — irreversible deformation rises to 5.02%, nearly 5×. Maximum deformation also increases from 21.86% to 28.74%, indicating the entire powder bed has become “soft and loose.” After compression, it can no longer form a dense, tightly contacting packing structure — contact points between particles and between particles and conductive additives are lost over large areas.
For method comparison, powder tests should use the same mass, die geometry, pressure sequence, hold time, and unloading calculation for every SOH state. Matching test conditions is necessary before interpreting a change in powder compaction behavior at different SOH as a material-aging effect.
3.3 Scale Three: Why Did Electrode Resistivity Rise More Than Thickness?
At the electrode level:
- Electrode thickness: 173.7 μm → 176.7 μm
- Electrode volume resistivity: 94.75 Ω·cm → 181.32 Ω·cm — nearly doubled
This difference shows why thickness alone is not sufficient to characterize an aged electrode. The thickness measurement describes the overall geometry under the test configuration, while resistivity is sensitive to the electrical pathway through the coating and its contacts.
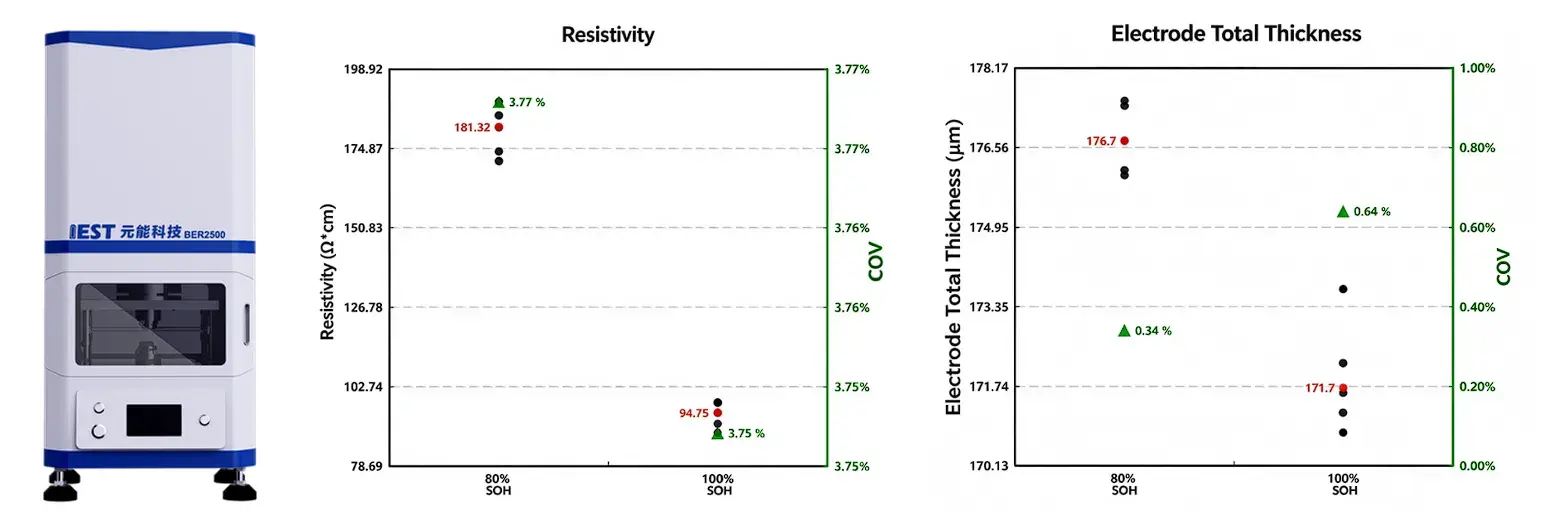
Figure 4. IEST BER2500 electrode resistivity tester and electrode sheet thickness and volume resistivity at different SOH levels.
Thickness increased by less than 2%, but resistivity nearly doubled. Behind this contrast are three superimposed effects: particle fragmentation and rearrangement, side-reaction product deposition, and internal stress release and relaxation within the coating. They increase porosity, make the coating “fluffy,” and reduce contact points — a slight dimensional increase delivers a severe blow to the conductive network. This is direct evidence that the electrode is “structurally aged.”
4. What Is the Relationship Between Particle Cracking and Electrode Resistance?
The three scales are not three isolated phenomena — they form a causal chain:
- Particles crack first — crushing strength drops 39.7%
- Powder irreversible deformation rises from 1.03% to 5.02% — nearly 5×
- The contact network collapses — electrode porosity increases, resistivity nearly doubles
- Macroscopically, this manifests as rising internal resistance, intensified polarization, and capacity fade — what we observe as 80% SOH
Particle cracking can contribute to a weaker or less continuous contact network; powder rearrangement can change packing and contact geometry; surface deposits can add barriers at interfaces. Macroscopically, this manifests as rising internal resistance, intensified polarization, and capacity fade — what we observe as 80% SOH