-
iestinstrument
4 Point Probe VS. 2 Point Probe Battery Resistance Test Methods
1. Preface
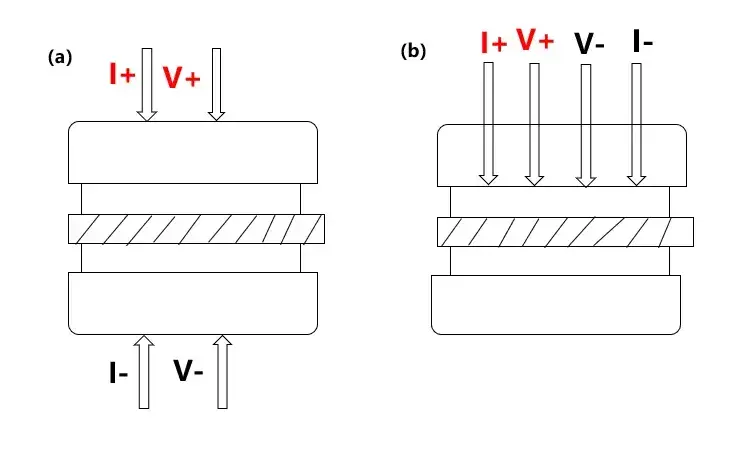
This paper presents a 2 probe vs 4 probe comparison for measuring electrode resistance in lithium-ion batteries, focusing on the 2 point probe and 4 point probe methods. Lithium-ion battery resistance is one of the key indicators for evaluating battery performance. Its magnitude directly influences capacity, cycle life, and safety. Factors affecting lithium-ion battery resistance include electrode materials, formulation, electrolyte, coating uniformity, and intrinsic electrode resistance. Electrode resistance reflects both the performance of the electrode material and the quality of its formulation. By analyzing electrode resistance test results, manufacturers can, on one hand, optimize the coating process and material formulation to enable rapid evaluation of material systems, and on the other hand, quickly identify, classify, and eliminate electrodes with excessively high resistance to prevent them from entering cell manufacturing, thereby improving the quality of the final products. The schematic diagram of the two test methods is as follows:

Figure 1. (a) Schematic of 2 point probe (b) Schematic of 4 point probe
During 2 point probe tests, the terminal is placed on the sample and input the AC voltage signal to collect the current for the sample resistance and obtain the sample resistivity through the conversion relationship; the 4 point probe are placed on the surface of the sample, and the voltage signal between the sample resistivity is obtained through the conversion relationship.
2. Experimental Equipment and Test Methods
2.1 Experimental Equipment
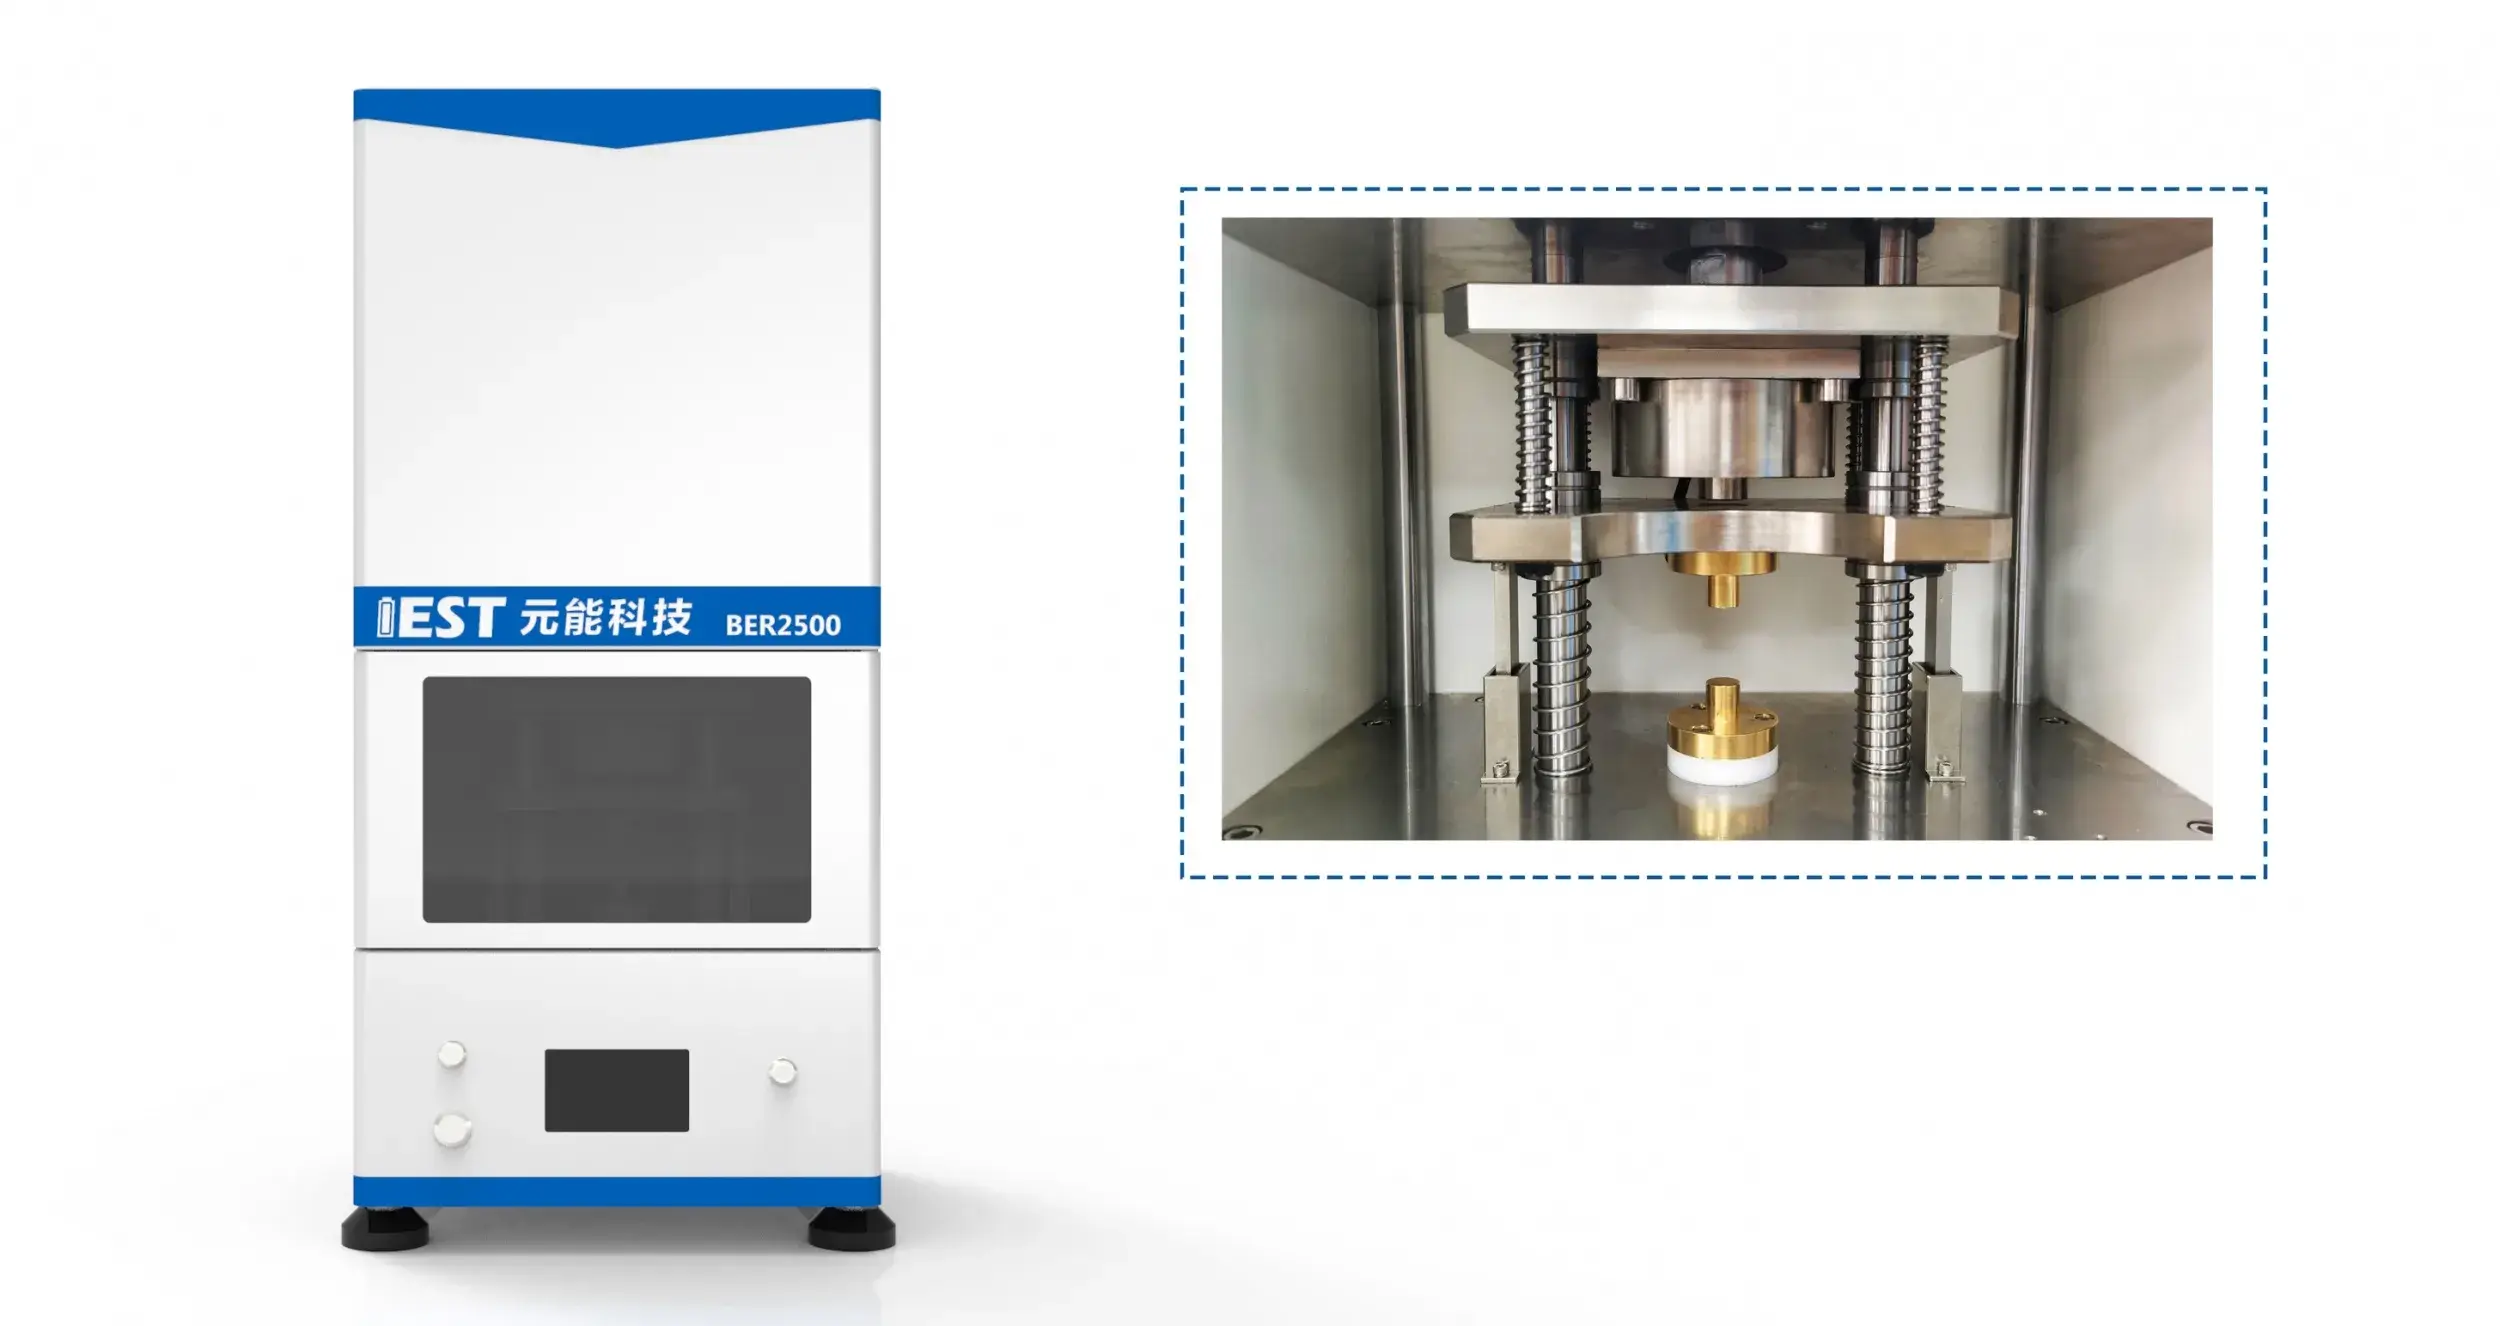
Battery Electrode Resistance Tester, model BER2500,electrode diameter of 14mm, can apply a pressure of 5~60MP a, the appearance of the equipment as shown in Figure 2.
Figure 2. (a) BER2500 appearance diagram (b) BER2500 structure diagram
2.2 Test Method
Set the parameters such as test pressure strength and pressure retention time on the MRMS software to start the test. The software automatically reads the electrode thickness, resistance, resistivity, conductivity and other data.
2.3 Sample Information
Select cathode electrodes cathode-1 and cathode-2, anode electrodes anode-1 and anode-2, pure membrane samples, aluminum foil, and copper foil, then measure the electrode resistance using both 2 point probe and 4 point probe methods.
3. Data Analysis
3.1 Foil-Based Electrode Resistance Test Analysis
For the cathode electrode resistivity tests, as shown in Figure 3(a), the resistivity of the low-resistance electrode cathode-1 measured by the four-probe method (2.1×10⁻⁶ Ω·cm) differed by approximately an order of magnitude from that of the pure aluminum foil (2.884×10⁻⁵ Ω·cm). However, for the high-resistance electrode cathode-2, the four-probe method yielded a significantly higher resistivity (1.3316 Ω·cm), far exceeding that of the pure aluminum foil. In Figure 3(b), the two-probe method measured resistivity for cathode-1 (1444.94 Ω·cm) was orders of magnitude greater than that of the aluminum foil (0.370026 Ω·cm). Similarly, for the high-resistance electrode cathode-2, the two-probe method also showed resistivity values substantially higher than the foil baseline.
From Figures 4(a) and 4(b), analogous trends were observed for anode electrodes. When testing low-resistance anode samples with the four-probe method, the influence of the coating layer could not be distinguished, whereas the method effectively differentiated high-resistance samples. In contrast, the two-probe method clearly revealed resistivity differences between coatings and the pure copper foil for both low- and high-resistance anode samples.
 |
 |
Figure 3. (a) Four-probe method cahtode electrode plate resistance test (b) Two-probe method cathode electrode plate resistance test
 |
 |
Figure 4. (a) 4 point probe method negative electrode plate resistance test (b) 2 point probe method negative electrode plate
3.2 Analysis of Foil Pure Membrane Resistance
For the binder-free pure film samples coated using the dry process, resistivity was measured by two methods. As shown in Figure 5, the 4 point probe measured resistivity of the single-layer film (0.27 Ω·cm) is nearly identical to that of the double-layer film (0.26 Ω·cm), and both are much higher than the resistivity of pure aluminum foil (2.884×10⁻⁵ Ω·cm) or pure copper foil (1.832×10⁻⁵ Ω·cm). Similarly, the 2 point probe measured resistivity of the single-layer film (1.27 Ω·cm) is nearly identical to that of the double-layer film (1.23 Ω·cm); however, the resistivity values obtained by the 2 point probe method are higher than those obtained by the 4 point probe method.

Figure 5. Pure membrane resistance test by 4 point probe and 2 point probe
3.3 Mechanism Analysis
The equivalent circuit diagram of the two test methods is shown in Figure 6, Figure a represents the circuit diagram of the 2 point probe electrode resistance, The figure shows that the current voltage is applied to the vertical ends of the sample, The result is the contact resistance of the polar sheet R, the R coating, the total resistance of the R collector fluid, Then the resistivity and the resistivity; Figure b is a schematic diagram of the circuit testing the electrode resistance by the 4 point probe method, The applied current is applied on the sample surface, So the current direction can be divided into paths 1,2, and 3, When the electrode sheet resistance is small, Electrons mostly pass through from path 2, Very arely through pathways 1 and 3, The measured electrode resistance is close to the foil resistance, When the sheet resistance is large, The probability of the electron passing through path 1 increases, The resistance value also increases, When testing the electrode sheet resistance by the 4 point probe method, Since the measured absolute value is small, Even getting up to the Ω level, The instrument accuracy, range and system pressure control and stability requirements are also high, It is therefore difficult to obtain stable data. In conclusion, it is appropriate to select the resistance of the composite layer.
 |
 |
Figure 6. (a) Schematic diagram of two probe circuit (b) Schematic diagram of four probe circuit
4. Summary
This paper compares the 2 probe vs 4 probe methods for measuring electrode resistance. The results indicate that when testing foil-based electrode samples, the resistance values measured by the 4 point probe method are significantly lower than those obtained by the two-probe method, and sometimes the measured resistance is nearly equal to the foil’s resistance, making it impossible to distinguish the influence of the coating. Furthermore, because the values measured by the4 point probe are very small, high requirements are imposed on instrument precision, measurement range, and the stability of the system’s pressure control, making it difficult to obtain stable data. Only when testing the coating layer without the foil do the resistance values reach the ohm level. In contrast, the 2 point probe method measures the total through-plane resistance of the electrode, which can significantly differentiate the differences in coatings, making it suitable for testing all types of electrodes for lithium batteries and supercapacitors.
5. References
[1] Hiroki Kondo et al. Influence of the Active Material on the Electronic Conductivity of the Positive Electrode in Lithium-Ion Batteries. Journal of The Electrochemical Society, 2019,166 (8) A1285-A1290
[2] B.G.Westphal et al. Influence of high intensive dry mixing and calendering on relative electrode resistivity determined via an advanced two point approach. Journal of Energy Storage 2017, 11, 76–85
[3] Nils Mainusch et al. New Contact Probe and Method to Measure Electrical Resistances in Battery Electrodes. Energy Technology.2016, 4, 1550-1557
Contact Us
If you are interested in our products and want to know more details, please leave a message here, we will reply you as soon as we can.


