-
iestinstrument
In-situ Analysis of Overcharge Swelling Behavior of Different Cathode Material Systems
In this paper, an in-situ swelling analyzer (SWE) is used to test the swelling thickness/temperature/internal resistance of three different cathode material systems (LCO/Graphite, NCM/Graphite, LFP/Graphite) under overcharge conditions, and compare and analyze Battery overcharge behavior.
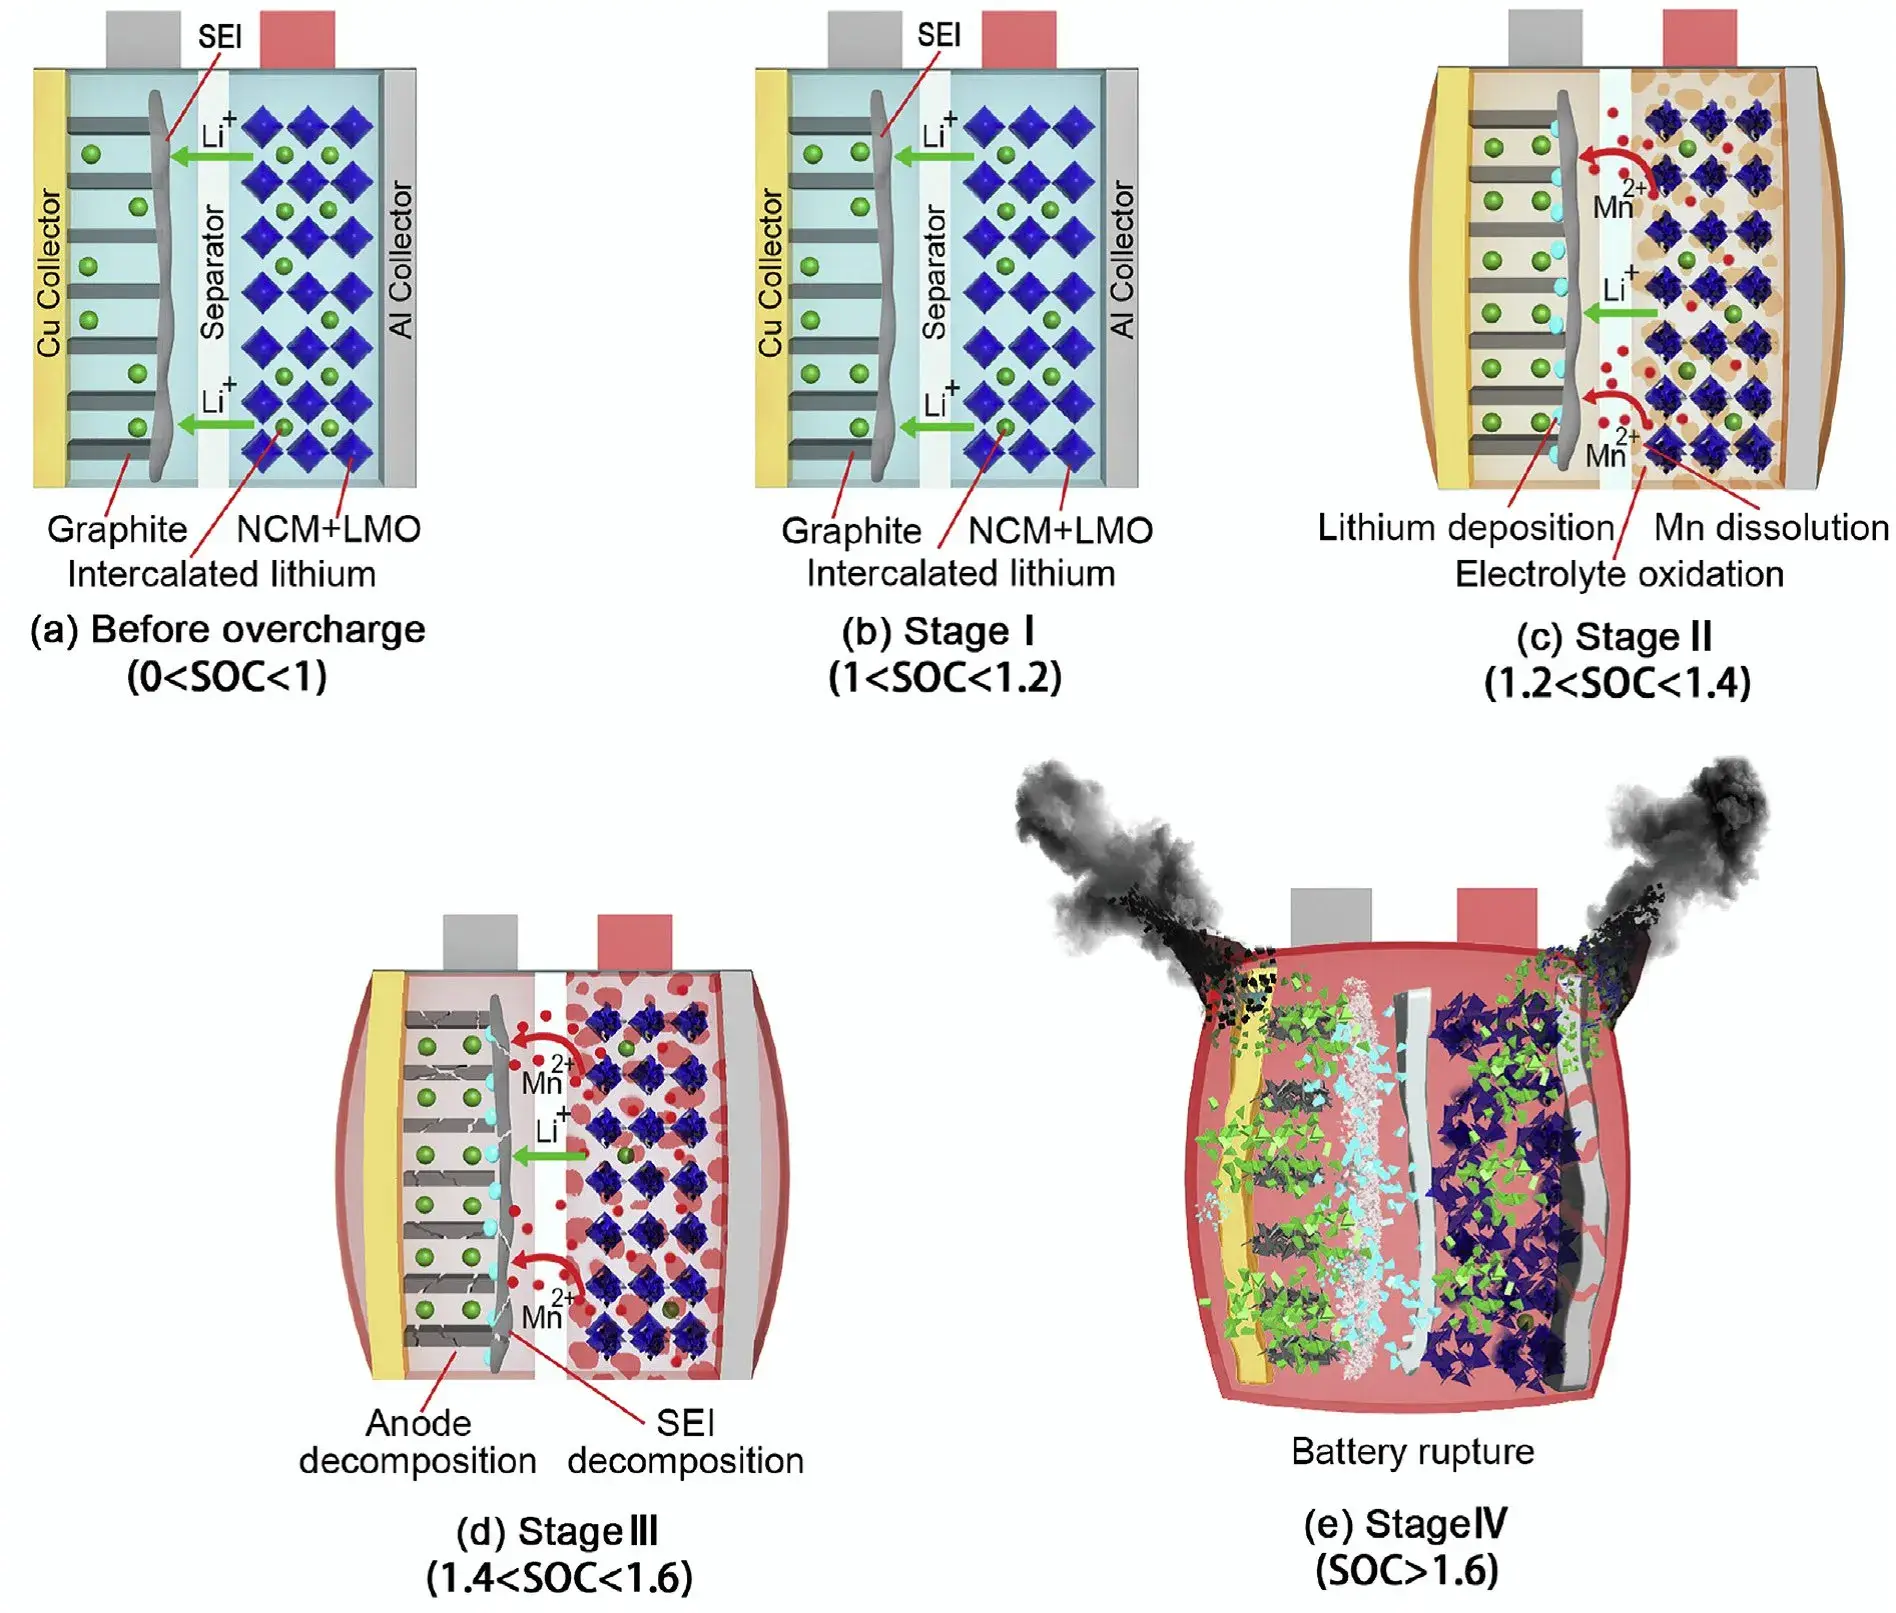
Recently, there have been endless reports of accidents about fire and explosion of lithium-ion electric vehicles. How to improve the safety performance of lithium-ion batteries is a common problem faced by materials companies, battery companies, and terminal car companies. When analyzing the safety performance of lithium-ion batteries, some abuse conditions are usually simulated, such as overcharging, overdischarging, squeezing, acupuncture, high and low temperature, etc. Figure 1 shows the failure diagram of the battery overcharging process. During the charging process, reactions such as lithium deposition, transition metal dissolution, electrolyte oxidation, and SEI decomposition will occur successively, which will cause the battery cell to generate heat, gas, and even catch fire and swelling. The safety performance indicators of lithium-ion batteries are detailed in the published national standards, GB 31241-2014 “Lithium-ion cells and batteries used in portable elec tronic equipments-Safety requirements” 1 and GB/T 31485-2015 ” Safety requirements and test methods for traction battery of electric vehicle” 2 stipulates that the battery must ensure no fire or swelling under certain overcharge conditions.
Figure 1. Lithium-ion battery overcharge failure diagram3
1. Experimental Equipment and Test Methods
1.1 Testing Equipment
In-situ swelling analyzer, model SWE2110 (IEST), can apply pressure range of 50~10000N, the appearance of the equipment is shown in Figure 2.
Figure 2. Appearance of SWE2110 Equipment
1.2 Test parameters:
1.2.1 Charging and discharging process
25℃ 1C CC.
1. 2.2 cell thickness expansion test
Put the cell to be tested into the corresponding channel of the equipment, open the MISS software, set the corresponding cell number of each channel, sampling frequency, test pressure and other parameters, and the software automatically reads the cell thickness, thickness change amount, test temperature, current, voltage, capacity and other data.
2. In-situ Monitoring of Lithium-ion Battery Cell Overcharging Behavior
2.1 Overcharging behavior of LCO/Graphite battery cell
The theoretical capacity of the LCO/Graphite cell used in this paper is 3Ah, and the normal voltage range is 3~4.35 V. The curves of internal resistance, thickness, temperature, and voltage of the cell during overcharging are shown in Figure 3(a), and when the voltage reaches 5.11 V, corresponding to 154% SOC of the power, the internal resistance, temperature, and thickness of the cell increase significantly, and start to generate gas, and the inflection point of the curves shows that the internal resistance is consistent with the inflection point of the voltage curve, while the inflection point of the temperature is slightly earlier than the voltage inflection point. From the inflection point of each curve, the internal resistance of the cell is consistent with the inflection point of the voltage curve, while the inflection point of the temperature is slightly earlier than the voltage inflection point, and the inflection point of the thickness is slightly later than the voltage inflection point, which indicates that when overcharging to a certain voltage, the temperature of the cell firstly increases, resulting in the decrease of the internal resistance of the cell first, and with the continued increase in temperature, the side reaction is intensified, and the internal resistance of the cell is increased, and due to the side reaction of the gas production and further led to the sharp increase in the thickness of the cell . From the correspondence between the differential capacity curve and the thickness change curve in Figure 3(b), it can be seen that every electrochemical reaction will lead to a change in the slope of the thickness curve of the cell. Therefore, it is necessary to pay attention to the changes in the internal resistance, temperature and thickness of the cell during the safety control of the cell, so as to warn the risk of fire and explosion of the cell in advance.
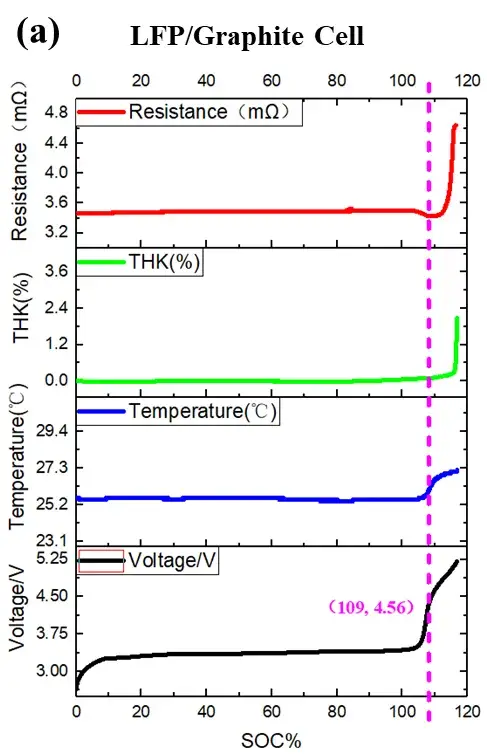
Figure 3. (a)Internal resistance, thickness, temperature and voltage curves of LCO system cells under overcharge conditions
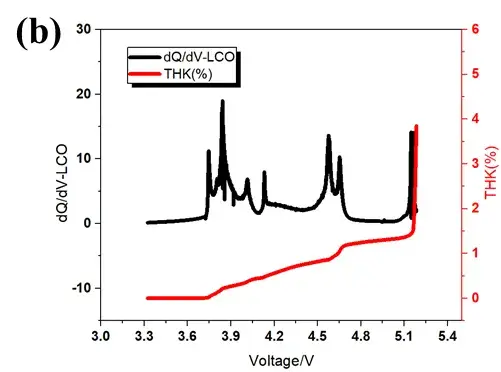
Figure 3. (b)Differential capacity curve and thickness curve
2.2 Overcharging behavior of LFP/Graphite battery cell
The theoretical capacity of the LFP/Graphite cell used in this paper is 3Ah, and the normal voltage range is 2.5~3.65 V. The curves of internal resistance, thickness, temperature, and voltage during overcharging of the cell are shown in Fig. 4(a), and when the voltage reaches 4.56 V, which corresponds to 109% of the SOC of the power, the internal resistance, temperature, and thickness of the cell increase significantly and start to produce gas. From the inflection point of each curve, the temperature inflection point is slightly earlier than the voltage inflection point, while the internal resistance and thickness inflection point is later than the voltage inflection point, which indicates that when overcharging to a certain voltage, the first thing that happens is that the temperature of the cell rises, resulting in the first decline in the internal resistance of the cell, with the temperature continuing to rise, the side reaction is intensified, the internal resistance of the cell increases, and due to the side reaction of the production of gas and further lead to the sharp increase in the thickness of the cell. From the correspondence between the differential capacity curve and the thickness change curve in Fig. 4(b), it can be seen that every electrochemical reaction will lead to a change in the slope of the thickness curve of the cell. Therefore, it is necessary to pay attention to the changes of the internal resistance, temperature and thickness of the cell during the safety control of the cell, so as to warn the risk of fire and explosion of the cell in advance.
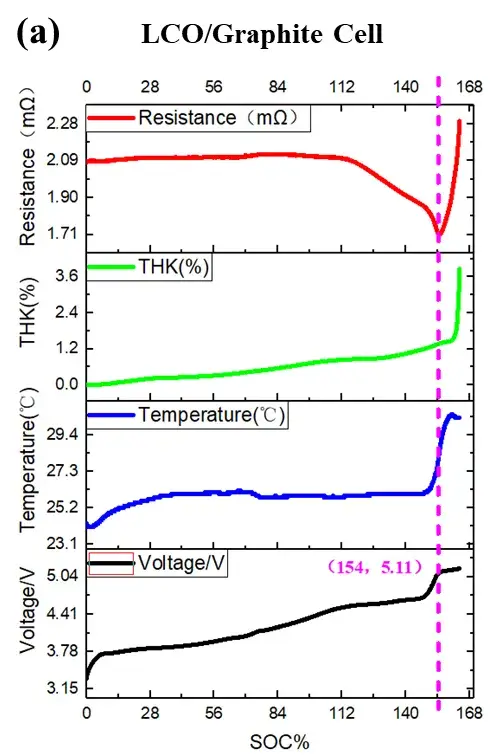
Figure 4. (a)Internal resistance, thickness, temperature and voltage curves of LFP system cells under overcharge conditions
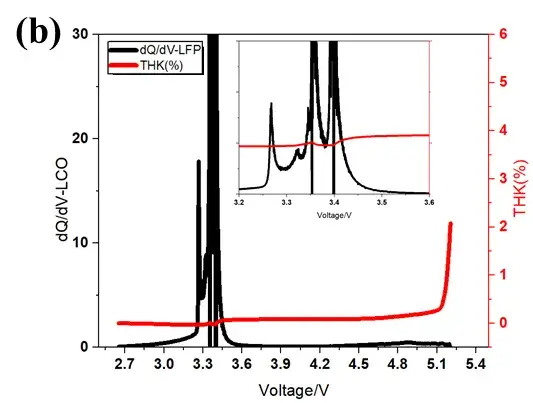
Figure 3. (b)Differential capacity curve and thickness curve
2.3 Overcharging behavior of NCM/Graphite battery cell
The theoretical capacity of the NCM/Graphite cell used in this paper is 2.4 Ah, and the normal voltage range is 2.8~4.35 V. The curves of internal resistance, thickness, temperature and voltage during the overcharging process of the cell are shown in Fig. 5(a), which show that when the voltage reaches 4.78 V, corresponding to 105% of the SOC, the internal resistance, temperature and thickness of the cell show an elevated tendency, and the production of gas begins, and the inflection points of temperature and thickness are basically consistent with the voltage inflection point, while the thickness inflection point is later than the voltage inflection point. From the inflection point of each curve, the inflection points of temperature and internal resistance are basically consistent with the voltage inflection point, while the thickness inflection point is later than the voltage inflection point, which indicates that when overcharging to a certain voltage, the first thing that happens is that the temperature of the cell rises, and the side reaction is intensified, leading to an increase in the internal resistance of the cell , and due to the side reaction of the production of gas, which further leads to the sharp increase in the thickness of the cell . From the correspondence between the differential capacity curve and the thickness change curve in Fig. 5(b), it can be seen that the de-embedded lithium reaction within the normal voltage range does not cause the thickness of the cell to change significantly, and when the voltage reaches about 5.25 V, the thickness suddenly increases sharply, and the cell is obviously gassed at this time, and there is no obvious electrochemical reaction peaks from the differential capacity at 5.25 V, which is probably due to the charging multiplication ratio 1C This may be due to the charging multiplier 1C is too large to cause the reaction peak position is not obvious. Therefore, it is necessary to pay attention to the changes of the internal resistance, temperature and thickness of the cell during the safety control of the cell, so as to warn the risk of fire and explosion of the cell in advance.
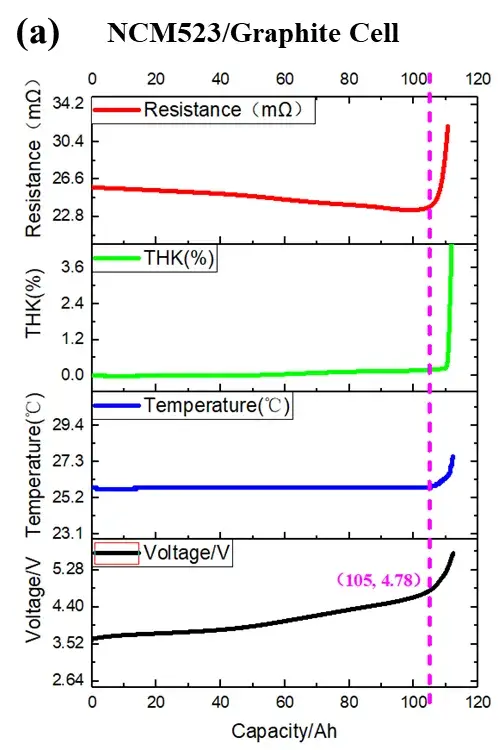
Figure 5.(a)Internal resistance, thickness, temperature and voltage curves of NCM system cells under overcharge conditions
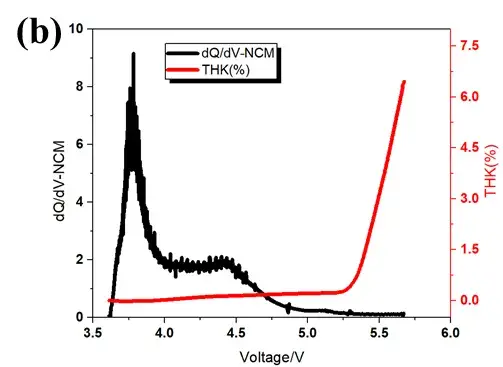
Figure 5.(b)differential capacity curve and thickness curve
3. Summary
In this paper, an in-situ swelling analyzer (SWE) was used to monitor the internal resistance, thickness, temperature and voltage changes during the overcharging process of three different cathode material systems, and it was found that when overcharging to a certain SOC, the surface temperature, internal resistance and thickness of the battery cell increased significantly, which is likely to lead to the fire and explosion of the battery cell if overcharging is continued, so it is necessary to pay attention to the changes of internal resistance, temperature and thickness of the battery cell during the safety control of the battery cell and take timely measures to prevent the uncontrollable and unsafe behavior of the battery cell. Therefore, we should pay attention to the changes of the internal resistance, temperature and thickness of the battery cell during the safety control of the battery cell, and take timely measures to prevent the battery cell from uncontrollable unsafe behavior.
4. References
[1] GB 31241-2014《Lithium-ion cells and batteries used in portable electronic equipments-Safety requirements》.
[2] GB/T 31485-2015《Safety requirements and test methods for traction battery of electric vehicle》.
[3] Dongsheng Ren, Xuning Feng, Languang Lu, Minggao Ouyang et al. An electrochemical-thermal coupled overcharge-to-thermal-runaway model for lithium ion battery. Journal of Power Sources, 364 (2017) 328-340.
Subscribe Us
Contact Us
If you are interested in our products and want to know more details, please leave a message here, we will reply you as soon as we can.


