

EIS diagnostic tests are non-destructive and reveal internal electrochemical dynamics (ohmic resistance, SEI, charge transfer, diffusion). For battery pack designers and cell manufacturers, understanding how compression from module packaging influences EIS spectra is critical for safety and performance: packaging preload can change contact resistance, electrode porosity, ionic pathways and even trigger particle fracture. This work links EIS testing with practical module-level concerns (preload and recommended SOC at assembly).
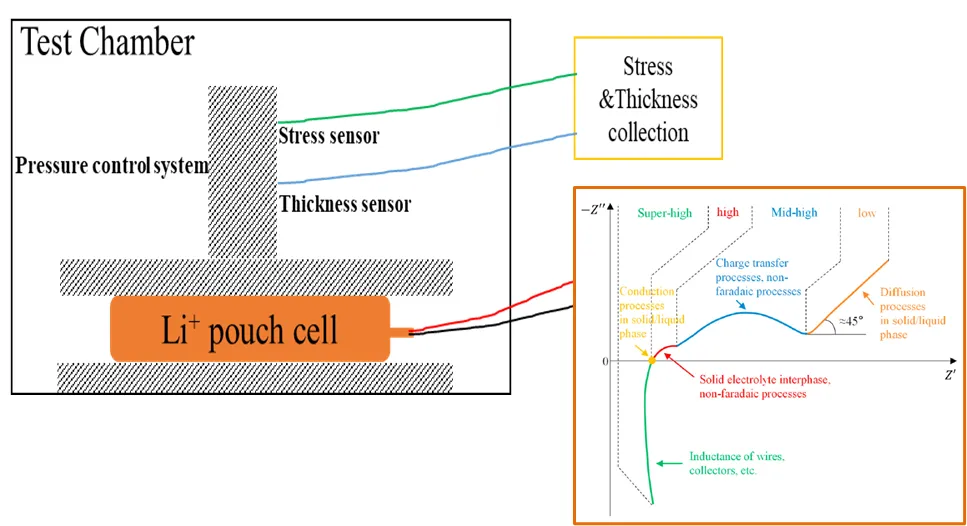
Figure 1. Overview figure. EIS testing measured on LCO/graphite pouch cells under varying module pressure, demonstrating the pressure–SOC–impedance relationship examined in this study.
In-situ swelling analyzer (SWE2110, IEST): applies and monitors mechanical pressure on pouch cells with precise, stepwise control.
Princeton PARSTAT MC electrochemical workstation: Performs high-precision EIS test measurements across a frequency range of 10 kHz to 0.02 Hz.
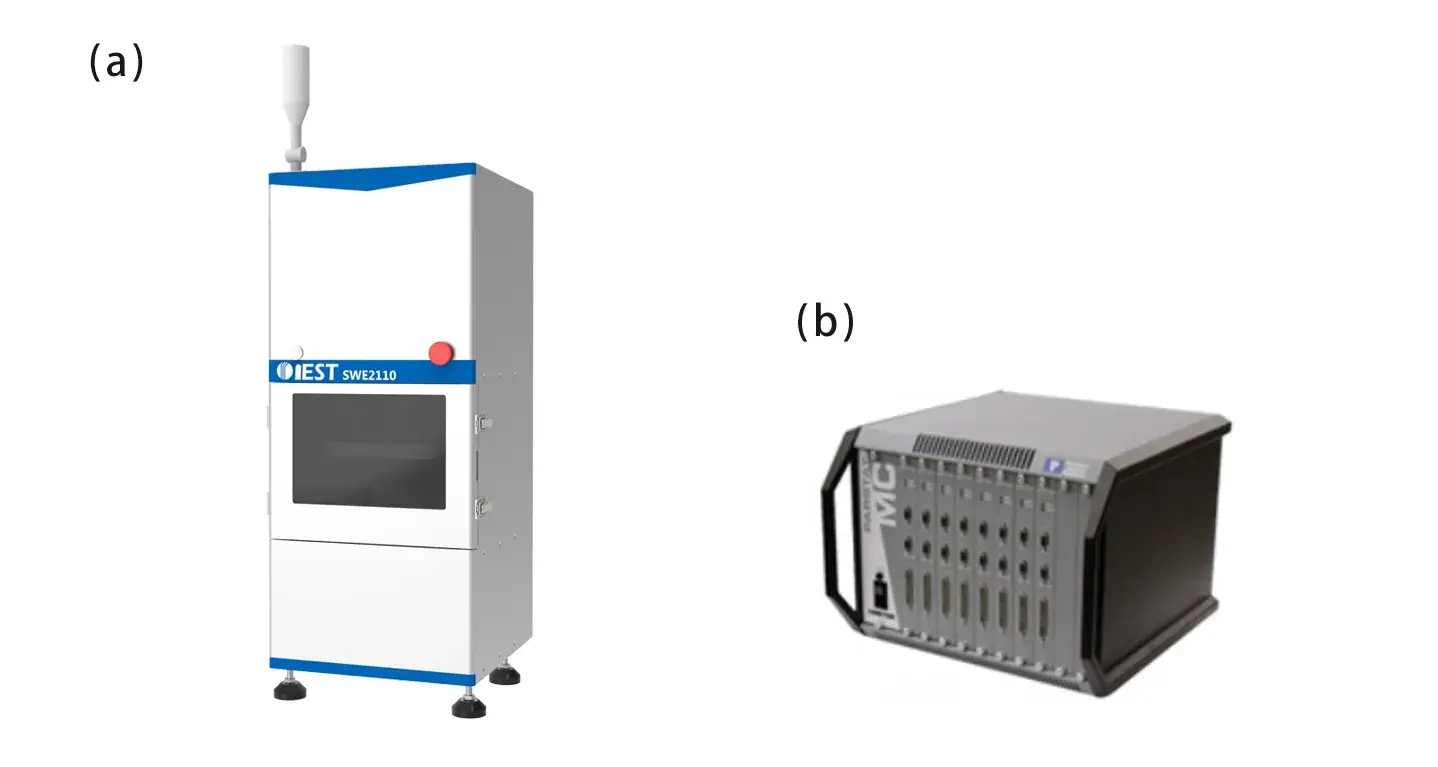
Figure 1. (a) IEST SWE2110 in-situ swelling analyzer, measured applying stepwise pressure from 100–1000 kg; (b) Princeton PARSTAT MC Electrochemical Workstation used for EIS diagnostic testing across 10 kHz–0.02 Hz.
Table 1. Information of Test Cell
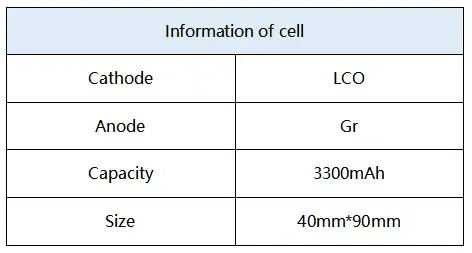
Five LCO/graphite pouch cells were prepared at SOC levels of 0%, 20%, 40%, 60%, and 80%.
Each cell was subjected to stepwise pressures from 100 kg to 1000 kg (0.27–2.7 MPa) using the SWE2110.
After 20 minutes of pressure stabilization, EIS testing was conducted to record Nyquist and Bode plots.
The EIS diagnostic test revealed two semicircles in the impedance spectra: a high-frequency segment associated with SEI film resistance, and a mid-to-low frequency region corresponding to charge transfer processes. Under increasing pressure, the low-frequency region (≤ 0.125 Hz) shifted significantly toward higher impedance, especially in low-SOC cells (e.g., 0% SOC). This indicates increased charge transfer and diffusion resistance under mechanical load. High-SOC cells (e.g., 80% SOC) showed minimal shift, suggesting better pressure tolerance.
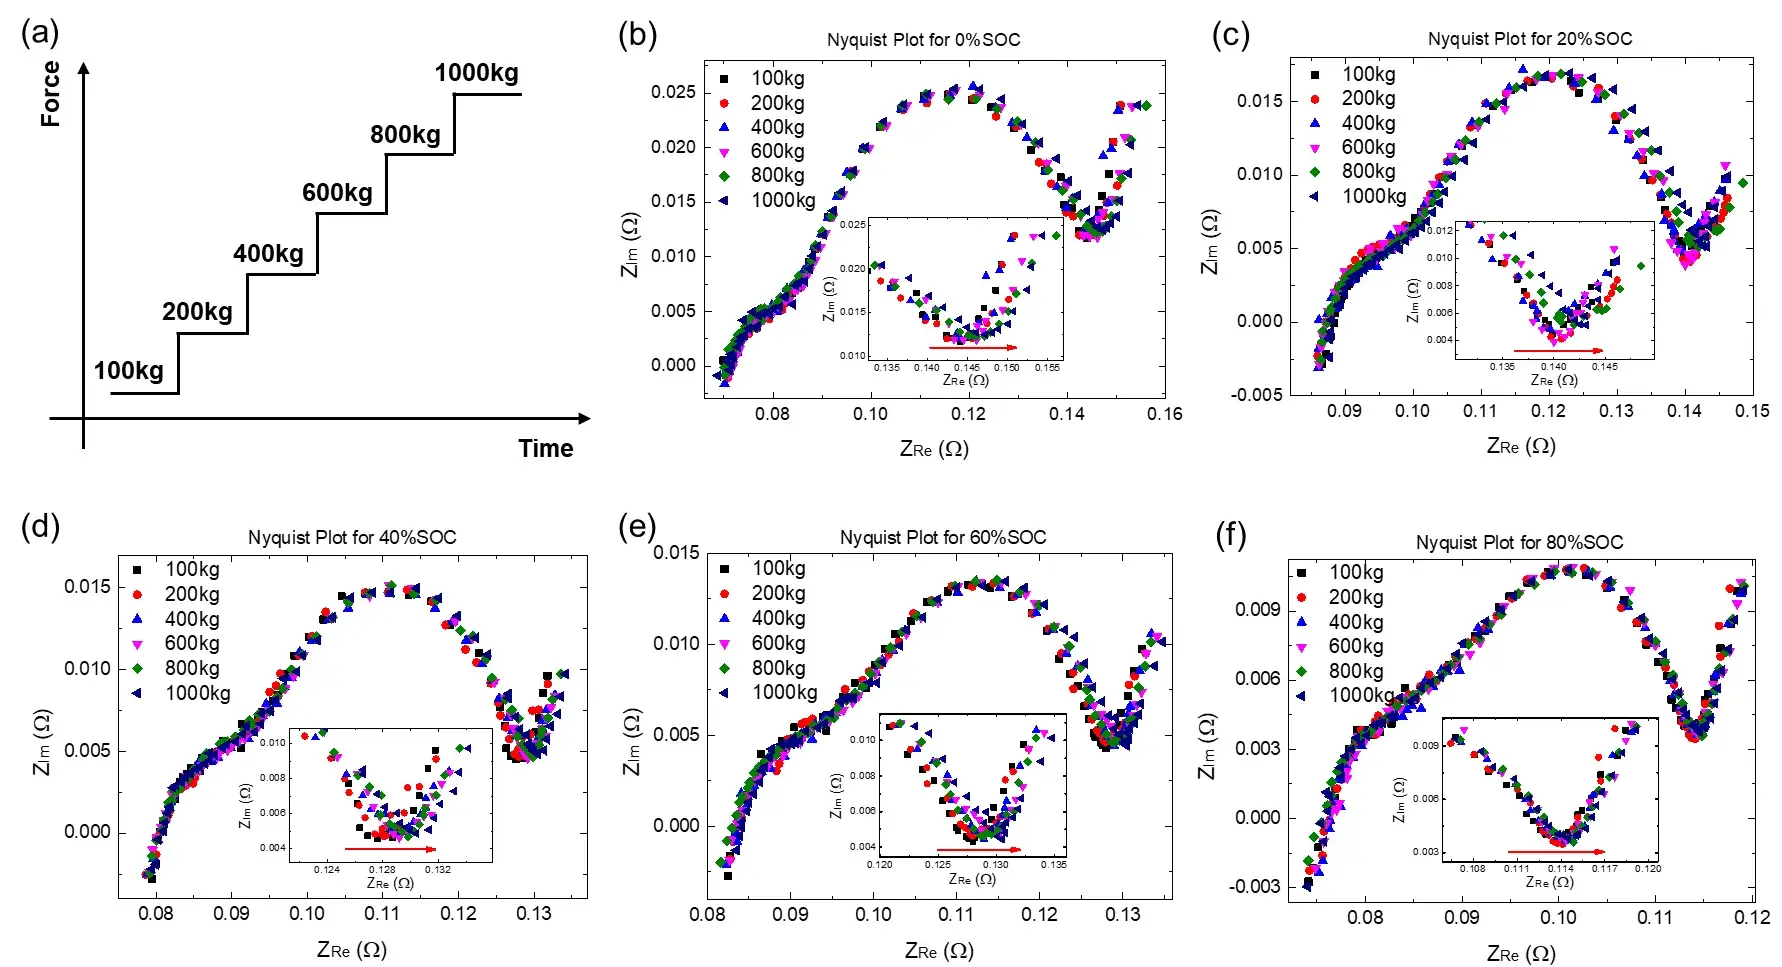
Figure 2. (a) Stepped pressurization schematic; (b–f) EIS spectra measured for cells at 0%, 20%, 40%, 60%, and 80% SOC under pressures of 100 kg, 200 kg, 400 kg, 600 kg, and 1000 kg, demonstrating the strongest low-frequency impedance shift at 0% SOC.
Further, we selected three different SOCs of high (80%), medium (40%), and low (0%), and analyzed the Bode plots of these three cells under different pressures, as shown in Figure 3. It can be seen that the imaginary part of the EIS test of these three SOC cells has no significant change under all pressures, no matter in the high-frequency region or the low-frequency region (as shown in Figure 3(b), (d), (f) ), However, different pressures mainly have obvious effects on the real part of the EIS in the low frequency region (as shown in Fig. 3(a), (c), (e)). In addition, it can also be seen from the insets of Figure 3(a), (c), and (e) that as the SOC increases, the increasing trend of the real part of the low-frequency region becomes less obvious, which is consistent with the previous results analyzed from the Nyquist diagram, indicating that the higher the SOC, the less susceptible the real part of the low-frequency EIS to the pressure.
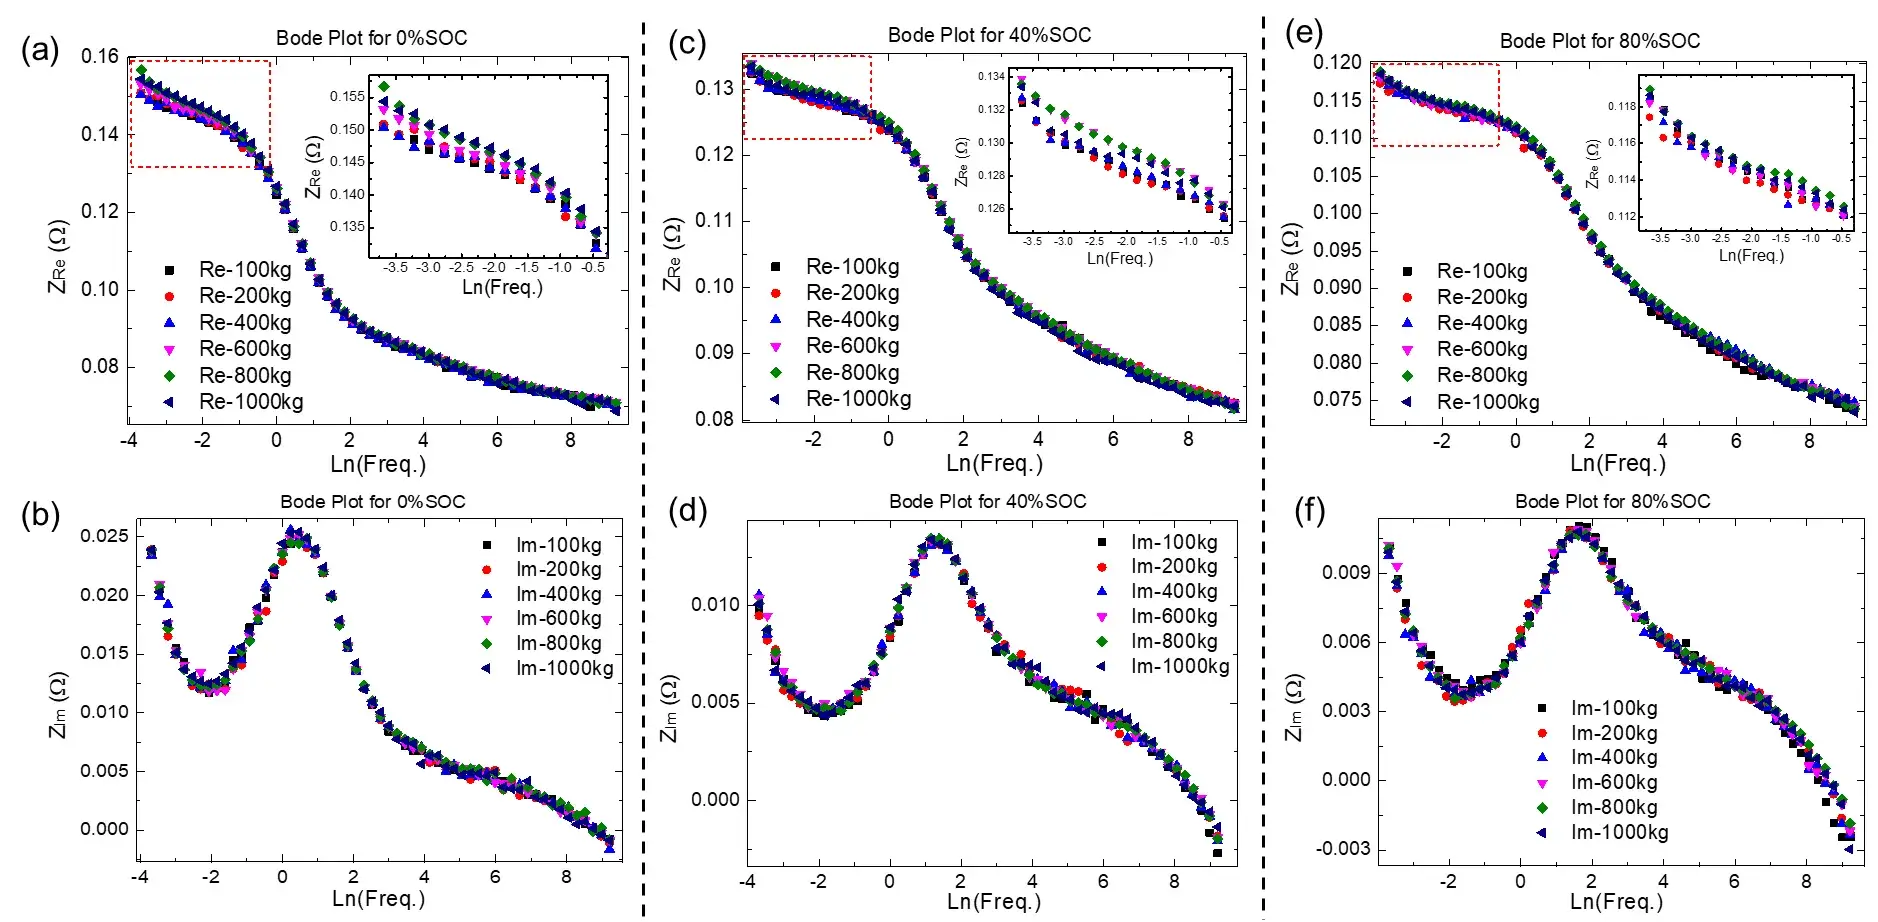
Figure 3. (a-b) are the real and imaginary parts of the 0% SOC cell as a function of frequency; (c-d) are the real and imaginary parts of the 40% SOC cell as a function of frequency; (e-f) are the real part and imaginary part of the 80% SOC cell as function of frequency.
Using a simplified Randles model (Figure 4), $R_{ct}$ was quantified for each SOC under varying pressures.
This divergence is attributed to structural changes in the graphite anode. At low SOC, there is almost no lithium intercalated between graphite layers, so the layers compress more readily under applied pressure; the interlayer spacing decreases and van der Waals forces between layers increase, significantly impeding the charge transfer and subsequent diffusion and intercalation process of Li+. At high SOC, the graphite negative electrode is close to a fully lithiated state; intercalated lithium provides structural support, so the graphite layer withstands greater pressure without significant compression, and the charge transfer and diffusion process face less resistance.
External pressure also compresses and deforms the positive and negative coatings, decreasing active-coating porosity, increasing ion transport resistance, and — at high pressure — potentially causing particle compression or fracture, which further raises $R_{ct}$.
Therefore, when a preload must be applied to a cell (for example, during module packaging), a cell assembled at higher SOC can be expected to show a smaller preload-related impact on cycling performance. When the initial SOC is relatively lower, excessive preload may reduce the lithium-intercalatable capacity of the graphite negative electrode and affect cycle efficiency.
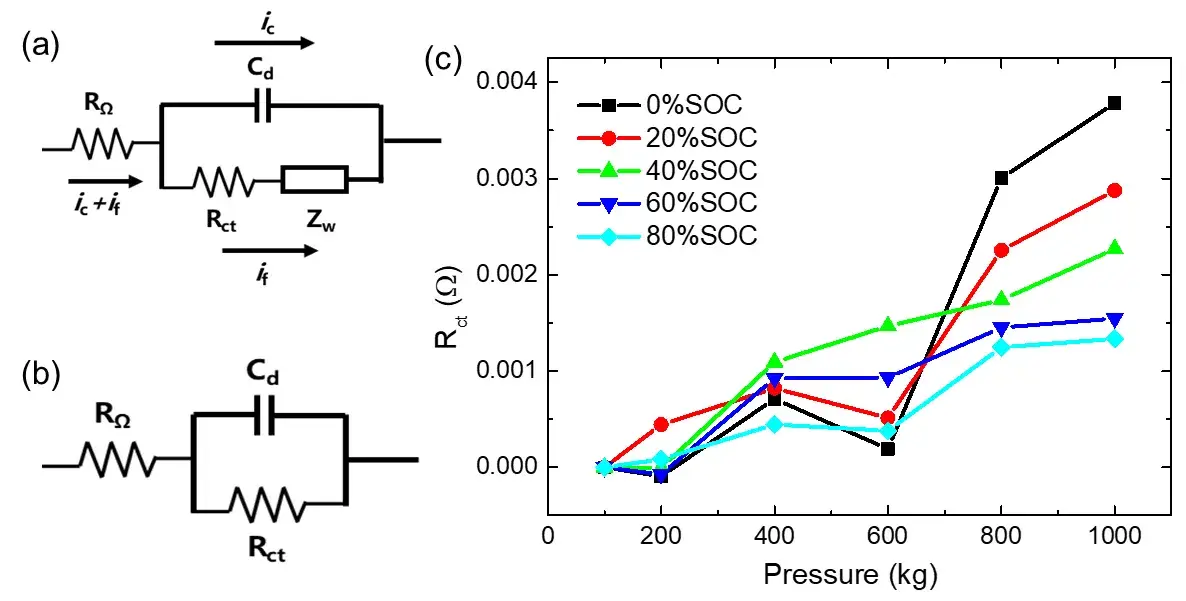
Figure 4. (a) Randles equivalent circuit commonly used for lithium-ion batteries; (b) simplified equivalent circuit after ignoring Warburg impedance at high frequency; (c) charge transfer resistance $R_{ct}$ measured across different SOC cells at increasing pressures, demonstrating a 3.78 mΩ increase at 0% SOC versus 1.34 mΩ at 80% SOC under 1000 kg load.
Why low-frequency increases? Pressure reduces electrode porosity and tortuosity, restricting ion pathways and increasing diffusion impedance (Warburg contribution). Particle crushing or coating deformation at high pressure can further raise Rct.
Why SOC matters? At high SOC the graphite negative electrode is already lithiated and mechanically more resistant to compression; low SOC graphite (delithiated) compresses more, amplifying the impedance rise.
Practical implication: Preload applied during module assembly will have less negative impact when cells are assembled at higher SOCs.
The IEST SWE2110 in-situ swelling analyzer applies calibrated, stepwise mechanical pressure to pouch cells while monitoring pressure stability in real time — the same setup used in this study to isolate pressure- and SOC-dependent impedance behavior via EIS diagnostic testing.
This study demonstrates that EIS diagnostic test methods are sensitive to mechanical pressure and SOC-dependent electrochemical behavior. Key findings include:
Low-frequency impedance increases significantly under pressure, especially in low-SOC cells.
The double-layer capacitance remains stable across all pressure conditions.
Applying pressure at high SOC mitigates increases in charge transfer resistance.
These insights underscore the importance of pressure management during battery packaging and support the use of EIS test protocols in battery manufacturing and R&D for enhanced performance and safety.
[1] H.M. Lu, H.F. Fang, X.M. He and L.Q. Xie, Effect of pressure on charge and discharge performance and expansion of ternary lithium battery. J. Power Technol. 41 (2017) 686-688.
[2] W.X. Hu, Y.F. Peng, Y.M. Wei, Y. Yang, Application of Electrochemical Impedance Spectroscopy to Degradation and Aging Research of Lithium-Ion Batteries. J. Phys. Chem. C 127 (2023) 4465-4495.
[3] Q.C. Zhuang, Z. Yang, L. Zhang and Y.H. Cui, Research process on diagnosis of electrochemical impedance spectroscopy in lithium-ion batteries. Prog. Chem. 32 (2020) 761-791.
[4] Allen J Budd, Larry R Faulkner, Electrochemical Methods-Principles and Applications [M], Second Edition, Chemical Industry Press, 2005.
EIS testing (electrochemical impedance spectroscopy testing) is a non-destructive diagnostic method that applies a small AC signal across a range of frequencies to a battery and measures the resulting impedance response. It reveals internal electrochemical dynamics such as ohmic resistance, SEI resistance, charge transfer resistance, and diffusion impedance without damaging the cell.
In this study, EIS diagnostic testing was used to measure how external module pressure (100–1000 kg, applied via an IEST SWE2110) and state of charge affect the impedance spectra of LCO/graphite pouch cells, isolating pressure-induced changes in charge transfer and diffusion resistance from changes in double-layer capacitance.
Charge transfer resistance (Rct) is the resistance associated with the electrochemical reaction at the electrode-electrolyte interface, extracted from the mid-to-low frequency semicircle of an EIS spectrum. Under mechanical pressure, electrode porosity decreases and ion pathways become restricted, which increases Rct — this study measured a 3.78 mΩ increase at 0% SOC under 1000 kg load.
At low SOC, the graphite negative electrode is largely delithiated and its layers compress more easily under pressure, increasing van der Waals forces between layers and impeding Li+ transport. At high SOC, intercalated lithium provides structural support that resists compression, so charge transfer resistance increases far less — about 1.34 mΩ at 80% SOC versus 3.78 mΩ at 0% SOC under the same 1000 kg load.
Based on this EIS testing data, assembling modules at higher SOC reduces the negative impact of packaging preload on charge transfer resistance and cycling performance. When modules must be assembled at lower SOC, engineers should avoid excessive structural preload to prevent permanent porosity loss and diffusion resistance increases.
Studying pressure-dependent impedance requires equipment that can apply calibrated, stepwise pressure to a pouch cell while it remains connected to an EIS tester. The IEST SWE2110 in-situ swelling analyzer applies and monitors mechanical pressure with stepwise control, allowing it to be paired with an electrochemical workstation such as the Princeton PARSTAT MC for synchronized EIS diagnostic testing under load.
