

During long-term cycling of lithium‑ion batteries, irreversible expansion caused by battery aging is a key factor limiting service life. Battery swelling is not merely a volume change; it is a direct mechanical manifestation of internal side reactions, SEI growth, and electrode structure evolution. In recent years, research into the mechanical behavior of batteries has grown rapidly.
For example, Niu et al. studied lithium iron phosphate/graphite pouch cells and demonstrated a clear correlation between state of health (SOH) and irreversible expansion force/displacement under rigid constraints. Their work, “Model development for predicting irreversible swelling of aged lithium iron phosphate/graphite pouch cells under different pressures and temperatures” (Journal of Power Sources, 2025), shows that expansion force/displacement increases steadily as the battery cycles and degrades. This insight offers a new approach to battery aging assessment: by monitoring changes in expansion force or displacement, we can infer the state of degradation.
To further validate this relationship, we designed two straightforward experiments using a high‑precision in‑situ expansion analyzer. Our goal was to systematically investigate the link between lithium‑ion battery aging, irreversible expansion, SOH, and battery swelling.
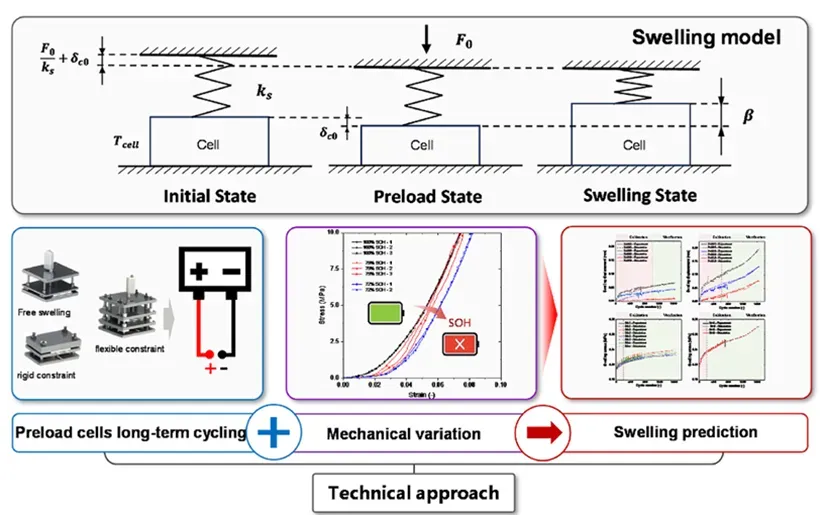
Figure 1. Schematic of the correlation between swelling and battery aging degradation as reported by Niu et al.
50 Ah NCM‑graphite cell, 25 °C, 1 C, 2.5–4.2 V, 120 cycles.
NCM‑graphite cells at three SOH levels: 100 % (fresh), 85 % (moderately aged), and 80 % (deeply aged).
Each SOH group tested at 0 % SOC, 50 % SOC, and 100 % SOC.
All tests were performed with the In-situ Battery Swelling analysis system (IEST SWE series). This system supports both constant-force (flexible constraint) and constant-gap (rigid constraint) modes, enabling precise measurement of thickness change and expansion force evolution during cycling.
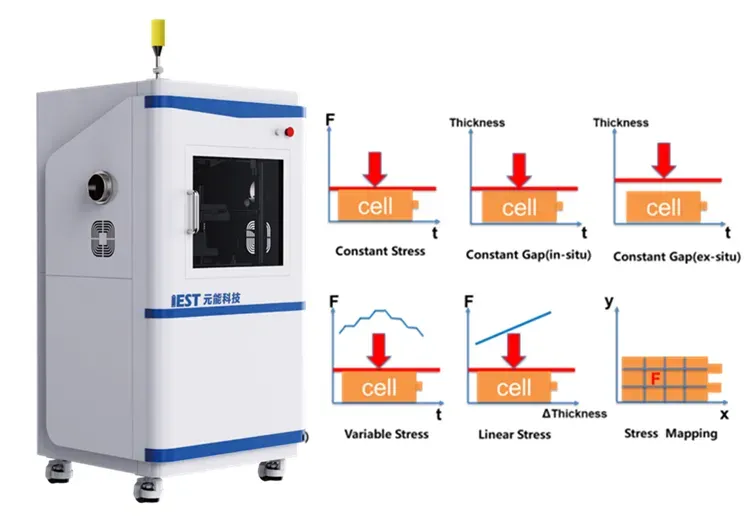
Figure 2. IEST in-situ battery swelling analysis system (SWE series) and its constant-force / constant-gap operating modes
During prolonged charge-discharge cycling, irreversible expansion increases steadily and cumulatively. This trend holds true under both rigid (constant-gap) and flexible (constant-force) constraints.
Under rigid constraints, the cell cannot expand freely. Each cycle’s aging effects – SEI thickening, electrode plastic deformation, and micro‑structure compaction – directly translate into a rising expansion force.
Under flexible constraints, the cell expands within a limited range, keeping expansion force relatively stable. However, irreversible expansion displacement continues to increase with cycle number.
In this work, cyclic swelling testing under constant-pressure conditions was conducted with the SWE series in-situ swelling analysis system. Figure 3(a) shows the change in swelling displacement percentage during 120 cycles as the cell charges and discharges. The result makes it clear that, under constant pressure, the percentage change in irreversible swelling displacement continues to increase as cycling progresses. Based on the cyclic swelling data, the swelling change at the end of each discharge cycle was defined as irreversible swelling. The relationship between irreversible swelling displacement percentage, SOH, and cycle number was then plotted as an SOH degradation curve, shown in Figure 3(b). The data indicate a simple trend: the more cycles the cell undergoes, the more severe the aging becomes, and the more pronounced the irreversible swelling becomes. This further confirms that the swelling signal can serve as a mechanical indicator of lithium-ion battery aging and can effectively reflect the cell’s degradation state.
Thus, expansion signals can serve as a mechanical ruler for battery aging — effectively reflecting the degradation state.
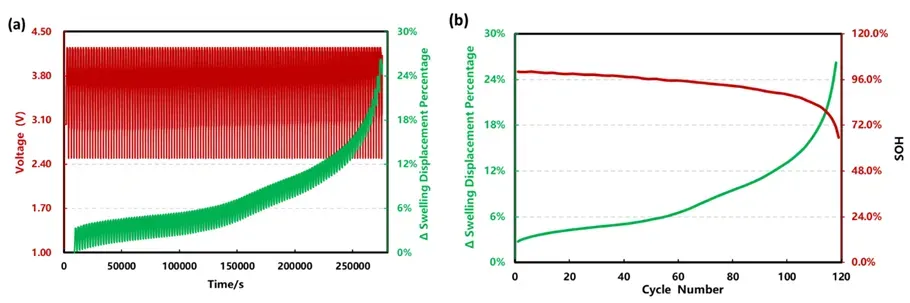
Figure 3. (a) Cyclic expansion displacement percentage and voltage profiles over 120 cycles. (b) Irreversible expansion displacement percentage and SOH degradation curve versus cycle number
In the reference study, prismatic LFP/graphite cells were aged at 45 °C and 1C to three SOH levels: 100%, 79%, and 72%. The cells were then disassembled, and 50 mm × 50 mm standard specimens were cut from the central region of the wound core. Quasi-static stack compression tests were performed to obtain stress-strain curves for cells at different SOH levels. The results showed that aging causes the stress-strain curve to shift to the right overall, and the lower the SOH, the more obvious the shift.
In this article, two sets of parallel cells (three cells per set) were subjected to high-rate charge-discharge cycling. Using the initial capacity as the reference, the battery state was defined as 85% SOH when the capacity dropped to 85% of the initial value, and as 80% SOH when the capacity dropped to 80% of the initial value. The three groups of cells at 100% SOH, 85% SOH, and 80% SOH were adjusted to 0% SOC, 50% SOC, and 100% SOC, respectively. Mechanical compression tests were then carried out in steady-state mode using the SWE series in-situ swelling analysis equipment to evaluate their stress-strain response. Figure 4 presents the compression test results. Compared with the pressure-loading stage in the reference study, this experiment covers both the loading and unloading stages, and the stress-strain percentage at different quantified pressures was calculated using the cell thickness corresponding to the initial pressure as the baseline. The results show that at low, medium, and high SOC, the stress-strain curves of all cells shift to the right as SOH decreases, which further supports the conclusion reported by Niu et al.
In addition, the magnitude of the change differs noticeably across SOC states. This may be related to differences in the intrinsic compressive response and heterogeneity of the positive and negative active materials at different lithium intercalation states. The internal electrode structure also changes with SOC. For graphite electrodes, insertion of different amounts of lithium causes the graphite lattice to expand by about 10% along the c-axis. Because graphite particles are often aligned parallel to the current collector, the main expansion and contraction occur in the thickness direction. This volume change further causes subtle deformation and reorganization of microscopic particles and pores during lithiation and delithiation, which affects ion and electron transport and leads to SOC-dependent nonuniformity in thickness and volume change. In some cases, this may even produce asymmetric behavior, such as contraction at the top electrode surface and swelling at the bottom surface. Furthermore, the elastic modulus, Poisson’s ratio, and density of graphite and NCM materials vary with lithium content, which in turn changes their mechanical response. In practical research, test conditions should therefore be selected comprehensively according to the cell chemistry and the specific focus of the study.
| Test Parameter | Reference Study (Niu et al.) | This Verification Study | Relevance to SOH–Degradation Relationship |
|---|---|---|---|
| Cell format / chemistry | Prismatic LFP/graphite | NCM-graphite pouch cell | Confirms the SOH-expansion relationship generalizes across cathode chemistries |
| Aging levels tested | SOH 100%, 79%, 72% | SOH 100%, 85%, 80% | Comparable SOH bands, allowing direct trend comparison |
| Compression stage covered | Loading only | Loading and unloading | Extends the degradation curve to the full compression cycle, not just the loading stage |
| SOC conditions | Not specified as a variable | 0%, 50%, 100% SOC per SOH group | Reveals SOC-dependent variation in the magnitude of the SOH-driven curve shift |
| Result trend | Stress-strain curve shifts right with aging | Same rightward shift confirmed at all three SOC levels | Cross-validates the reference finding under an expanded test matrix |
Extending the SOH–Degradation Relationship With a Full Loading-Unloading Test Method
The reference study by Niu et al. characterized the SOH-driven stress-strain shift under the pressure-loading stage alone. Evaluating the same relationship across both loading and unloading — the way a cell is actually compressed and released within a pack — requires an in-situ system capable of synchronized, quantified pressure control through a full compression cycle rather than a single-direction press. The IEST SWE series in-situ battery swelling analysis system used in this verification study supports both constant-force and constant-gap operating modes within one instrument, allowing the same SOH-degradation relationship to be examined across the complete loading-unloading cycle and across multiple SOC conditions in a single test matrix.
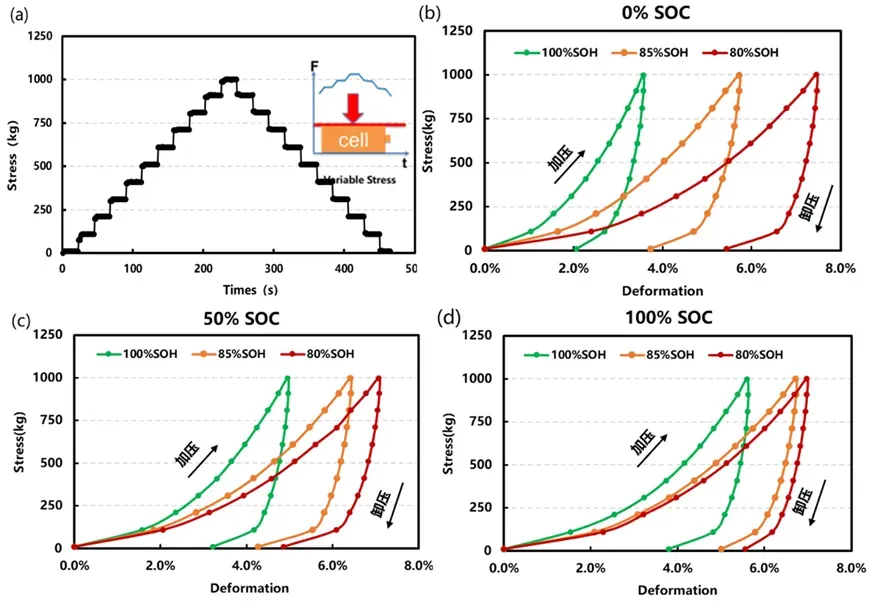
Figure 4. (a) Compression load profile used for mechanical evaluation. (b), (c), (d) Stress‑strain curves at 0 % SOC, 50 % SOC, and 100 % SOC for cells with different SOH levels (100 %, 85 %, 80 %).
The IEST SWE series in-situ battery swelling analysis system measures both expansion force (constant-gap) and thickness change (constant-force) through full loading-unloading cycles, across multiple SOC and SOH conditions.
Using the IEST In-situ swelling analysis system(SWE series ), and by designing verification experiments based on the work of Niu Z. et al., this study further confirms the intrinsic relationship among cycling degradation, swelling force, and SOH. The results establish a direct connection between mechanical signals and battery aging degradation, and they provide a useful new direction for building early-warning models for lithium-ion battery health assessment.
[1] Niu Z, Sun Z, Zhang S, Xia Y. Model development for predicting irreversible swelling of aged lithium iron phosphate/graphite pouch cells under different pressures and temperatures. Journal of Power Sources, 2025, 641: 236884.
SOH (state of health) describes a battery’s present capacity or performance relative to its original specification, expressed as a percentage. As SOH declines through degradation modes such as SEI growth and electrode structural change, irreversible expansion force and displacement increase steadily and cumulatively, making expansion signals a mechanical indicator of the underlying degradation.
In this study, NCM-graphite cells at SOH 85% and SOH 80% showed a stress-strain curve shifted further to the right than the fresh (SOH 100%) cell at every tested SOC level (0%, 50%, 100%), with the shift becoming more pronounced as SOH dropped from 85% to 80%, consistent with progressively increasing irreversible expansion.
Irreversible expansion is the portion of a cell’s thickness or force increase during cycling that does not return to baseline after discharge, and it accumulates progressively with aging. It differs from reversible expansion, which occurs and reverses within a single charge-discharge cycle, and it can be tracked using the swelling change at the end of each discharge cycle.
Battery swelling is a direct mechanical manifestation of internal side reactions, SEI growth, and electrode structure evolution. As cycling progresses and the cell ages, the irreversible portion of this swelling increases, so tracking swelling displacement or force over time provides a mechanical signal that reflects the cell’s SOH degradation curve.
In this study, the NCM-graphite cell was cycled between 2.5 V and 4.2 V at 1C and 25 °C, corresponding to the chemistry’s standard operating window. Using the manufacturer-specified voltage range for the cell chemistry under test helps ensure that observed expansion changes reflect normal aging rather than voltage-induced stress outside typical operating conditions.
The magnitude of the SOH-driven stress-strain shift differs across SOC states because the intrinsic compressive response and lithium-intercalation-dependent properties (elastic modulus, Poisson’s ratio, density) of graphite and NCM electrode materials vary with lithium content, producing SOC-dependent nonuniformity in thickness and volume change alongside the aging-driven trend.
