

The electrode slurry is a crucial intermediate product in lithium-ion battery manufacturing. Its homogeneity and stability significantly impact the consistency and electrochemical performance of the final cells. Currently, battery slurry viscosity is often the sole parameter used for slurry monitoring, which fails to fully assess the uniformity and stability of the slurry’s electrical properties — and therefore its traceability to cell performance.
Slurry resistivity offers a more direct insight. This parameter is highly sensitive to the battery slurry formulation, including the types and amounts of active materials, conductive agents, and binders. Furthermore, as slurries rest after mixing, gelation or sedimentation can occur (Figure 1), leading to measurable changes in resistivity. Monitoring slurry resistivity therefore provides a powerful method for characterizing both electrical homogeneity and stability of battery slurries — enabling traceability from slurry mixing quality to cell performance.
Implementing resistivity monitoring serves three functions: material evaluation and screening (assessing the impact of different components on conductive network quality); process control (rapidly identifying mixing anomalies before defective batches progress downstream); and sedimentation detection (defining the maximum static hold time before re-agitation is required).
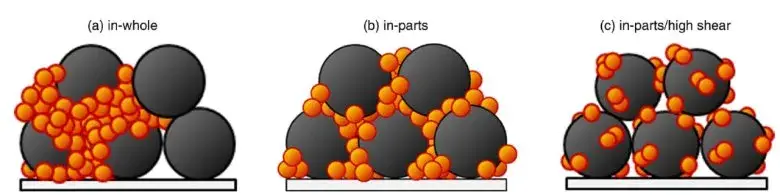
Figure 1. Three mixing states for LCO and conductive carbon particles in battery electrode slurry — uniform dispersion produces lowest resistivity (highest anode slurry conductivity); sedimentation produces vertically non-uniform resistivity
The IEST BSR2300 Battery Slurry Resistivity Tester, featuring three independent electrode channels, was used for all measurements. The BSR2300 is designed as a dedicated slurry stability analysis instrument for battery slurries, enabling simultaneous resistivity measurement at three vertical positions within the same slurry container — critical for sedimentation detection.
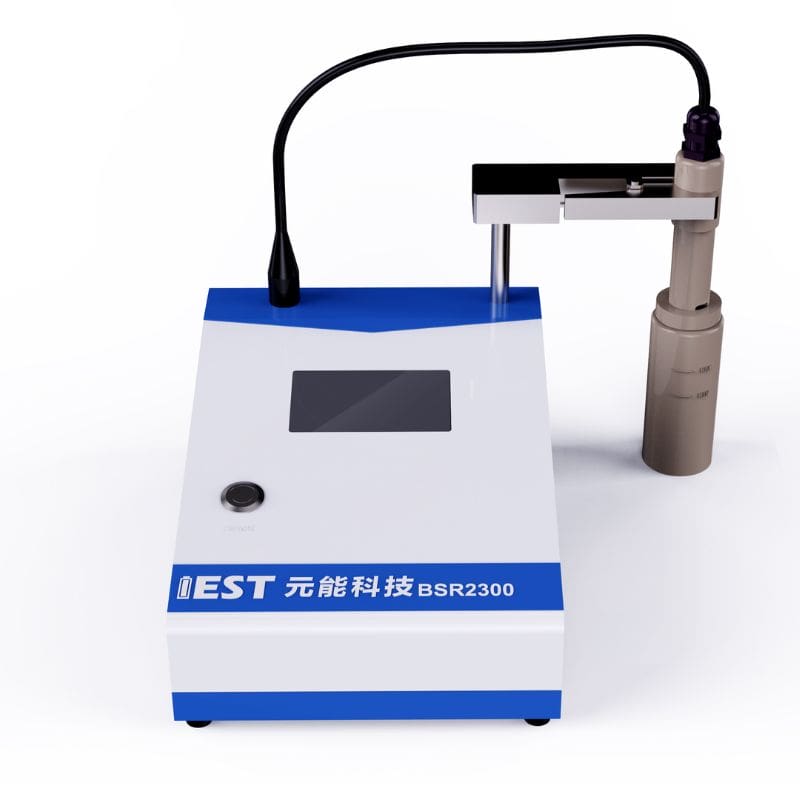
The slurry sample is placed in a beaker with a mouth diameter greater than 35 mm. The electrode probe is immersed into the slurry and gently agitated to ensure the electrode surface is fully wetted. The accompanying BSR2300 software collects real-time resistivity data from each of the three electrode channels simultaneously, enabling either single-point evaluation or continuous time-series sedimentation monitoring.
Battery slurry viscosity governs particle mobility and contact probability in the slurry. We compared two conductive carbon slurries with different viscosities while keeping the formulation nominally constant. Key results:
The higher-viscosity slurry exhibited lower resistivity (higher anode slurry conductivity) than the lower-viscosity slurry under identical measurement conditions.
This implies that at higher viscosity, conductive particles form more stable contacts and a more continuous percolation network — resulting in better electronic connectivity and lower resistivity.
As a practical metric, resistivity measurement validates whether batches with the same target viscosity maintain comparable conductive connectivity. Two slurries can match on battery slurry viscosity but diverge on resistivity, indicating a difference in particle dispersion state that viscometry alone would miss.
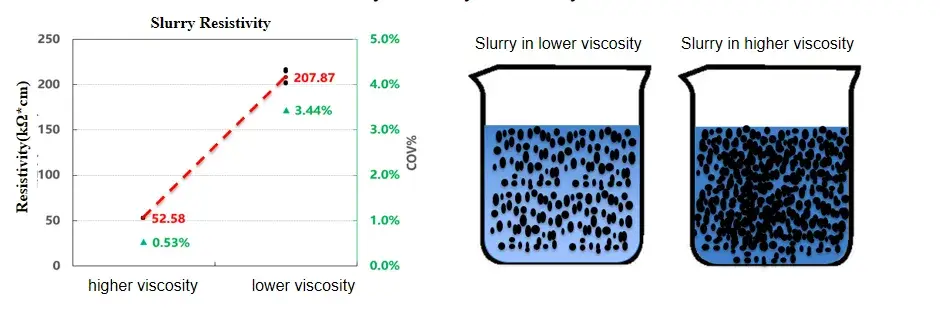
Figure 2. Battery slurry resistivity comparison for two viscosity grades (same formulation) — higher-viscosity slurry shows lower resistivity and better conductive connectivity
Diluting a conductive carbon slurry by different multiples changes the concentration of conductive carbon particles per unit volume and affects their dispersion state. As the dilution factor increases, the concentration of conductive carbon decreases and the battery slurry resistivity increases monotonically. This monotonic relationship makes resistivity measurement a sensitive probe of formulation concentration. In mass production with a fixed slurry formulation, resistivity testing across different batches of the same target concentration provides a fast check of batch-to-batch process stability — and enables traceability from the mixing stage to downstream coating quality.
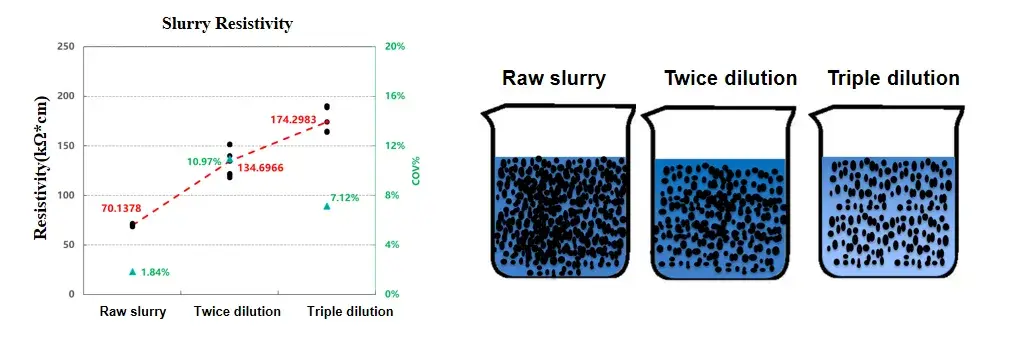
Figure 3. Slurry resistivity vs dilution factor — resistivity increases monotonically as conductive carbon concentration decreases, enabling formulation concentration monitoring across batches
Sedimentation in battery slurry is a critical quality concern: as particles settle, the slurry loses vertical homogeneity, compromising coating uniformity and ultimately cell consistency. We monitored an NCM811 electrode slurry continuously over three days using the BSR2300’s three vertical electrode channels at distinct heights within the storage bottle. Notable observations:
On the third day morning, the lower channel’s resistivity dropped markedly — indicating that active material and conductive carbon particles from upper layers had settled to the bottom, locally increasing the bottom concentration and conductivity.
By tracing resistivity versus time at multiple vertical positions, the slurry’s practical maximum static hold time (how long the slurry can sit before significant sedimentation compromises homogeneity) was directly identified from the resistivity divergence point.
This time-resolved, multi-height approach provides production staff with a clear, data-driven criterion for deciding when to re-agitate stored slurry — reducing process scrap and electrode coating variability caused by sedimented slurry.
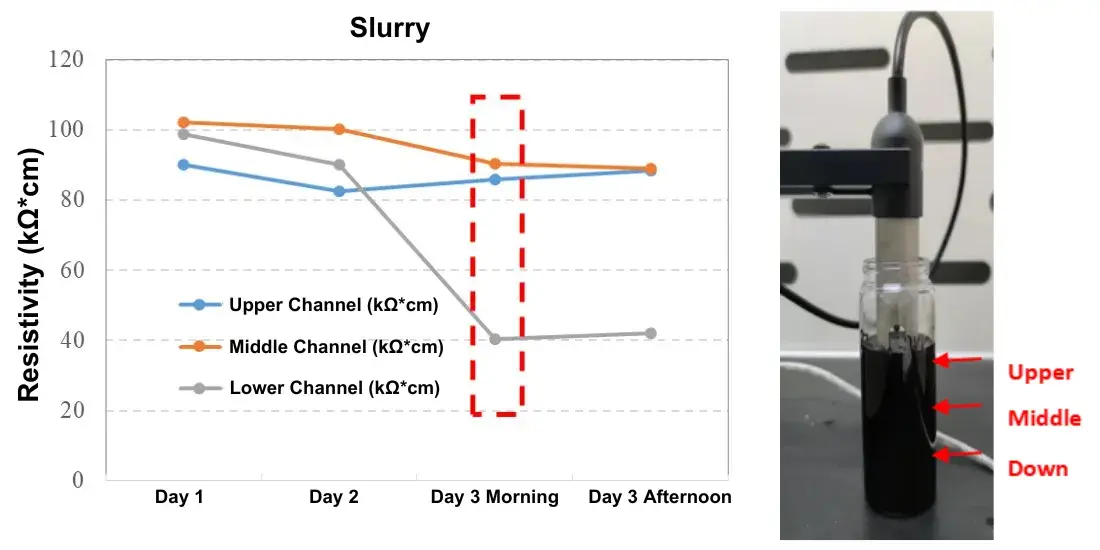
Figure 4. NCM811 slurry resistivity vs time at multiple vertical heights — bottom-channel drop on day 3 confirms sedimentation in battery slurry onset; defines the maximum static hold time before re-agitation is required
Container geometry: Use a standardized container with mouth diameter >35 mm to ensure consistent probe immersion depth and repeatable vertical channel positioning.
Probe wetting: Brief stirring to wet the probe before measurement is essential — air gaps on the probe surface artificially increase measured resistivity.
Multi-height probing: Use vertical channel spacing to detect incipient sedimentation in battery slurry — single-point measurement at one height cannot reveal vertical concentration gradients.
Recipe-specific tolerance limits: Define acceptable resistivity windows for each battery slurry formulation and viscosity grade; flag batches that fall outside the window before they reach coating.
Combine with viscosity: Interpret slurry resistivity in the context of battery slurry viscosity measurements and visual inspection — rheology changes can mimic formulation drift in the resistivity signal.
This study used the IEST BSR2300 Battery Slurry Resistivity Tester to monitor slurry resistivity under different viscosities, different dilution multiples, and different static hold times — distinguishing slurry condition differences that battery slurry viscosity monitoring alone cannot resolve. By establishing resistivity specification limits for each slurry formulation, R&D and production teams can effectively monitor mixing process stability, quantify maximum standing time before sedimentation compromises homogeneity, and enable electrical traceability from slurry to cell. This supports consistent, high-quality electrode manufacturing and faster detection of out-of-specification batches before they proceed to coating.
[1] B.G. Westphal et al. Journal of Energy Storage 11 (2017) 76–85.
[2] Kentaro Kuratani, Kaoru Ishibashi, Yoshiyuki Komoda, Ruri Hidema, Hiroshi Suzuki and Hironori Kobayashi1. Controlling of Dispersion State of Particles in Slurry and Electrochemical Properties of Electrodes. Journal of the Electrochemical Society, 166 (4) A501-A506 (2019)
Battery slurry resistivity (unit: Ω·cm or Ω·m) is the intrinsic electrical resistance per unit geometry of the electrode slurry — the inverse of anode slurry conductivity. It measures how easily electrons can flow through the conductive network formed by carbon particles dispersed in the slurry, which depends on particle concentration, dispersion uniformity, and contact probability. Battery slurry viscosity, by contrast, characterizes flow resistance and is governed by binder content, solid loading, and particle morphology. The two are related but not equivalent: higher viscosity generally increases conductive particle contact time and probability, producing lower resistivity — as this study demonstrates, where the higher-viscosity slurry showed measurably lower resistivity at identical formulation. However, two batches can match on viscosity but diverge on resistivity if their particle dispersion states differ. Measuring both provides more complete characterization of slurry quality than either parameter alone.
Sedimentation in battery slurry is detected by continuous multi-height resistivity monitoring — placing electrode probes at different vertical positions in the slurry storage container and tracking how resistivity changes at each height over time. As particles settle, the bottom of the container becomes enriched with active material and conductive carbon while the top becomes depleted. This vertical concentration gradient manifests as a resistivity divergence between heights: the bottom resistivity drops (more conductive — higher particle concentration) while the upper heights show rising resistivity. In this study, NCM811 slurry was monitored continuously for 3 days: the bottom channel showed a clear resistivity drop on the morning of day 3, identifying the onset of significant sedimentation and defining the maximum static hold time for that slurry formulation before re-agitation is required. The IEST BSR2300‘s three independent vertical channels make this multi-height sedimentation monitoring practical and continuous.
The best stability analysis equipment for battery slurries combines multi-channel real-time resistivity measurement with vertical probe positioning. The IEST BSR2300 Battery Slurry Resistance Tester meets these requirements: it provides three independent electrode channels for simultaneous measurement at different vertical positions in the same slurry container, enabling both instantaneous formulation uniformity assessment and time-resolved sedimentation monitoring. A standardized measurement probe, simple sample preparation (a beaker with mouth diameter >35 mm), and real-time data logging make the BSR2300 suitable for both R&D slurry evaluation and production-line quality control. For comprehensive battery slurry characterization, it is best used alongside a viscometer — resistivity captures conductive network quality and sedimentation behavior, while viscosity captures rheological flow characteristics and binder performance.
Battery slurry resistivity is highly sensitive to the concentration of conductive carbon particles in the slurry — the primary carrier of electronic conductivity in the slurry phase. As the slurry is diluted (reducing conductive carbon concentration per unit volume), the inter-particle contact probability decreases, breaking the continuous conductive percolation network. This produces a monotonic increase in resistivity with dilution factor, as demonstrated in Case Study B: each successive dilution step increased measured slurry resistivity. Conversely, higher solid loading concentrates particles and lowers resistivity. In production, this concentration sensitivity can be used for batch-to-batch formulation consistency monitoring: if resistivity of a nominally identical batch deviates from the established tolerance window, it indicates a formulation error, mixing process deviation, or material property change — flagging the batch before it reaches the electrode coating stage.
Traceability from slurry to cell means establishing a quantitative, documented link between slurry quality metrics at the mixing stage and the resulting electrochemical performance of the finished cells. Slurry resistivity enables this traceability through two mechanisms. First, it provides a direct electrical measurement of the conductive network quality in the slurry — and the quality of this network correlates with electrode conductivity after coating and calendering, which in turn affects cell internal resistance, rate capability, and capacity. Second, by recording resistivity at the mixing stage for every batch, production teams build a database linking resistivity-at-mixing to cell-level performance outcomes — allowing them to predict cell quality from slurry resistivity before any cells are assembled. Deviations in batch resistivity can be flagged and investigated before the batch proceeds to coating, preventing defective batches from entering the cell production flow and reducing end-of-line scrap rates.
