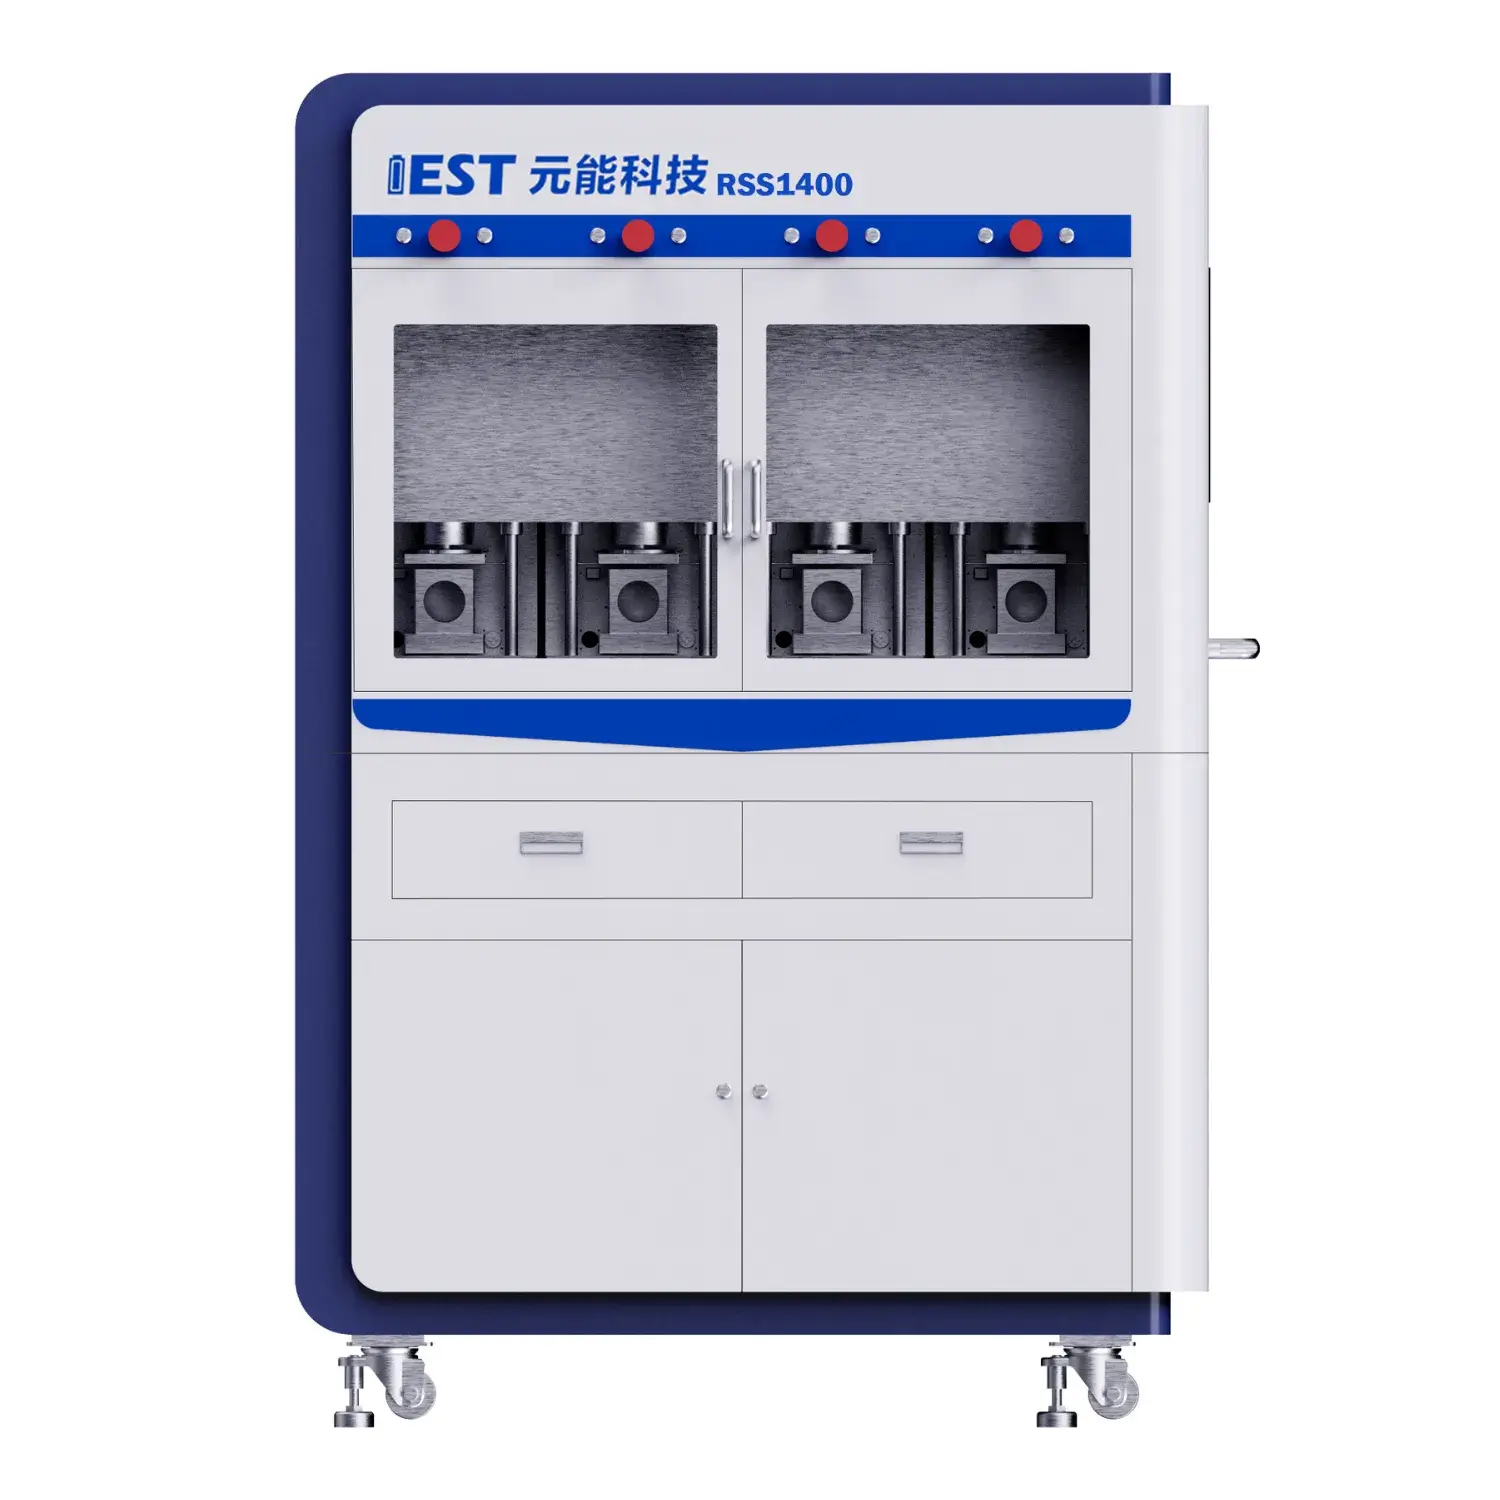
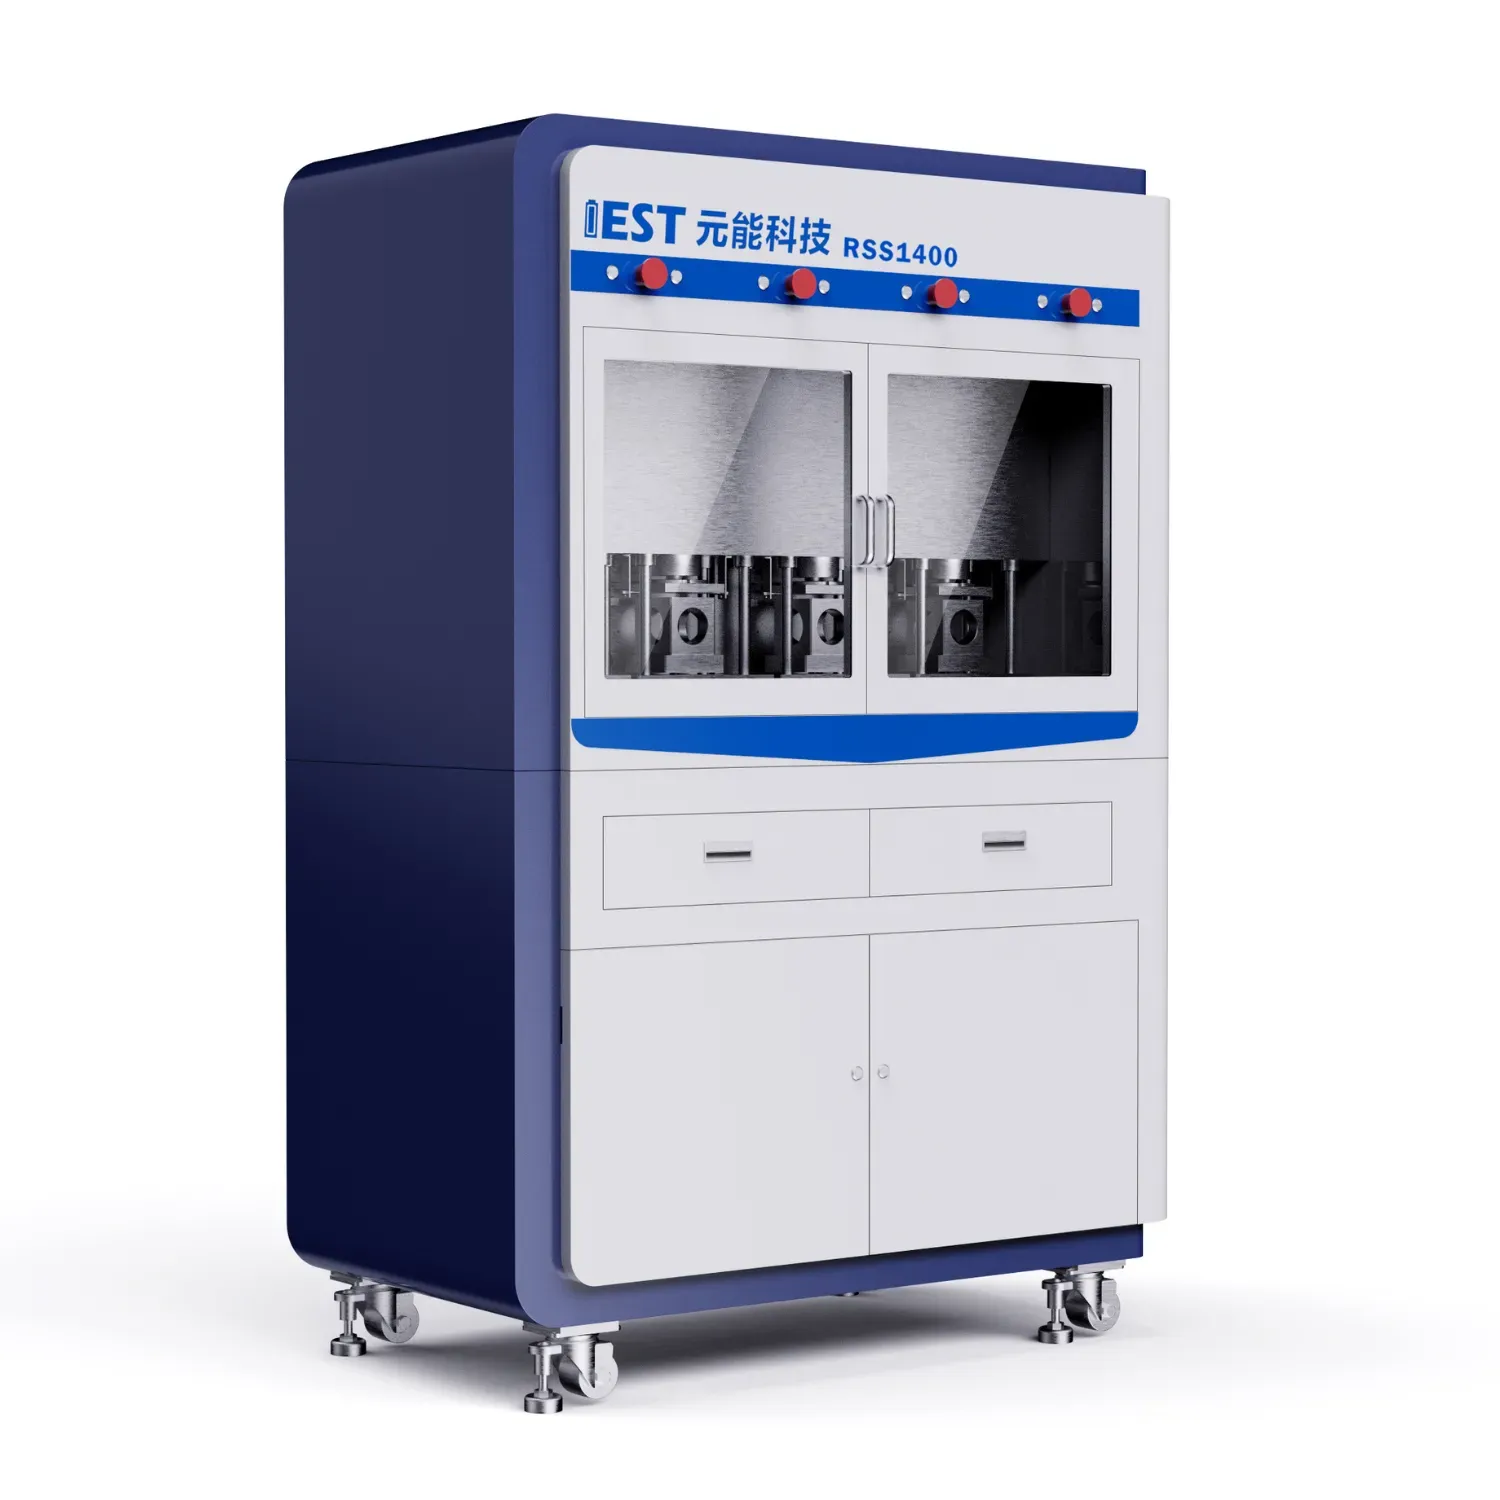
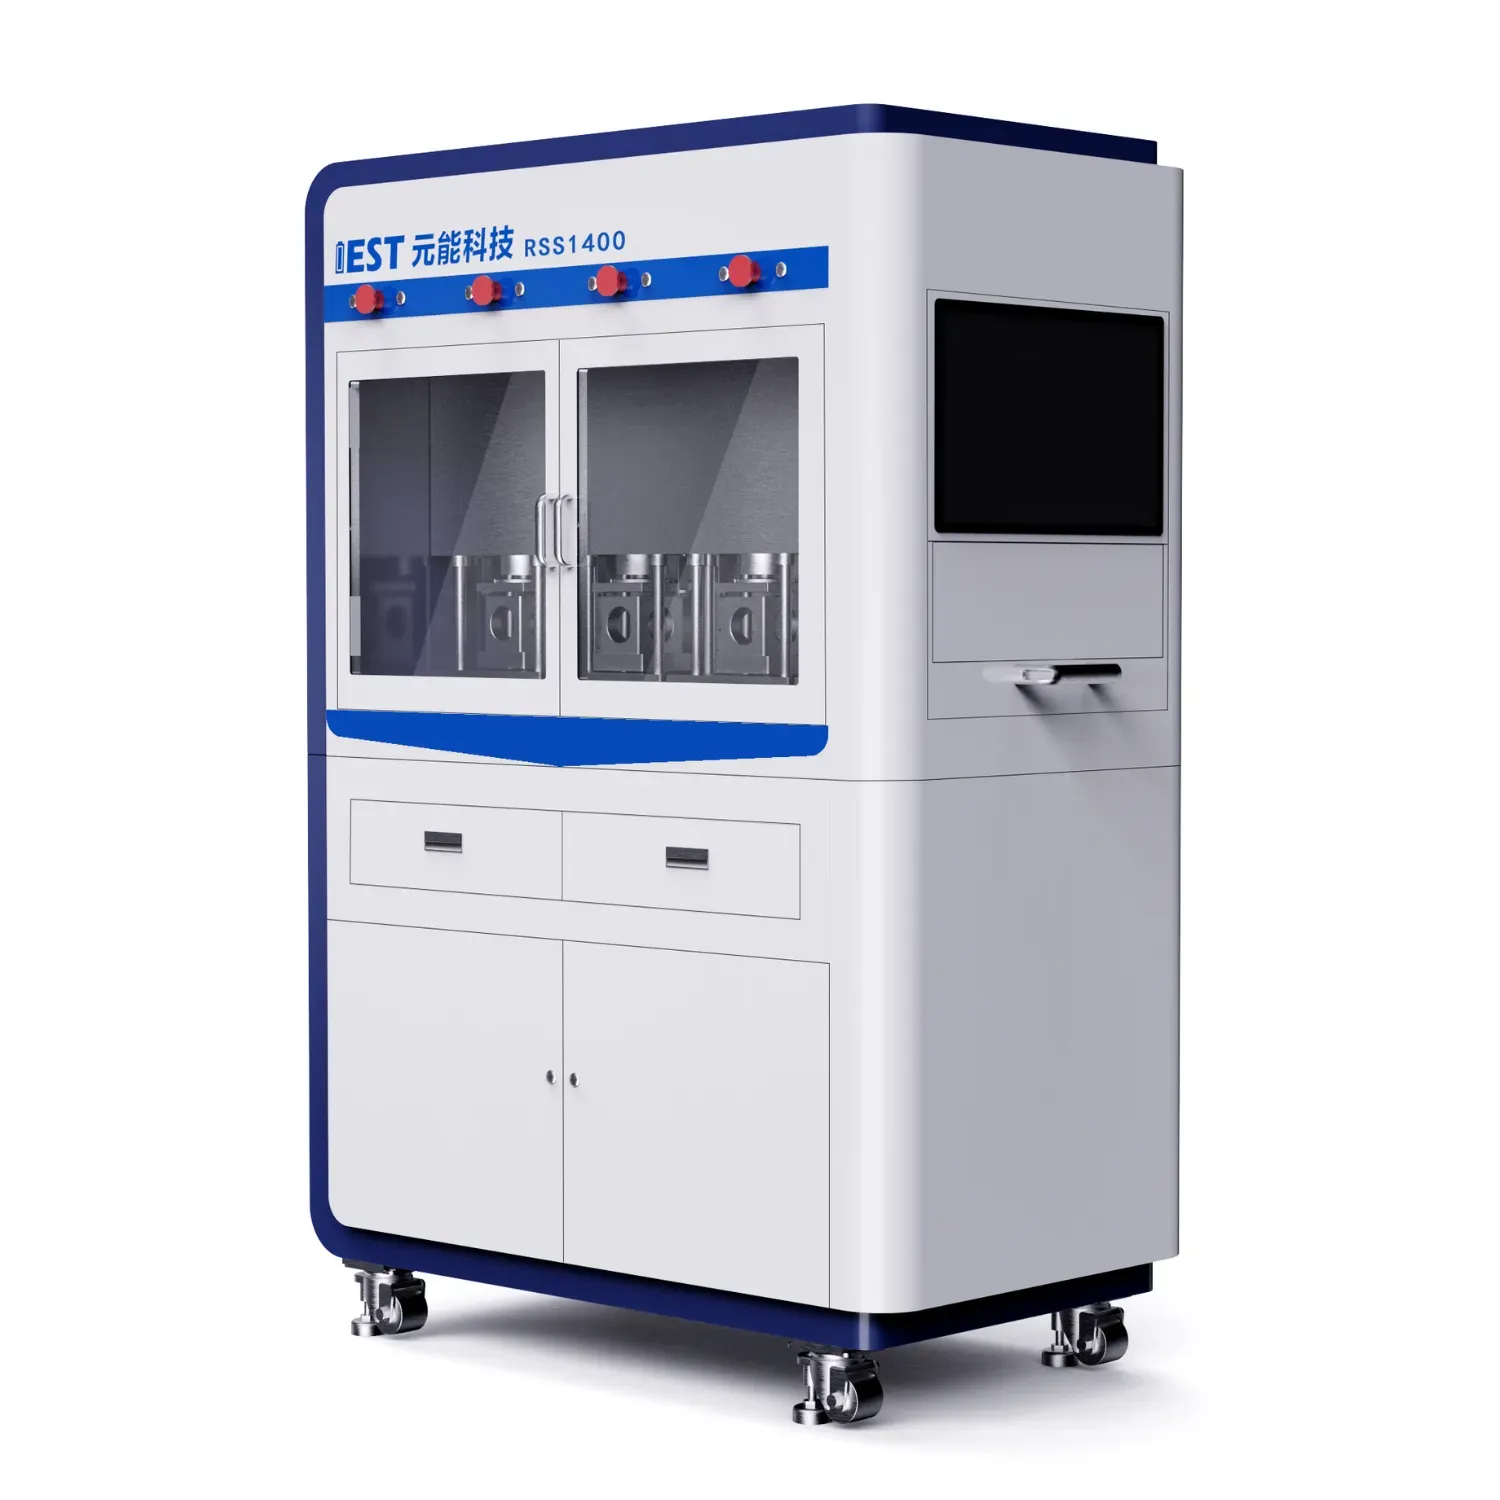
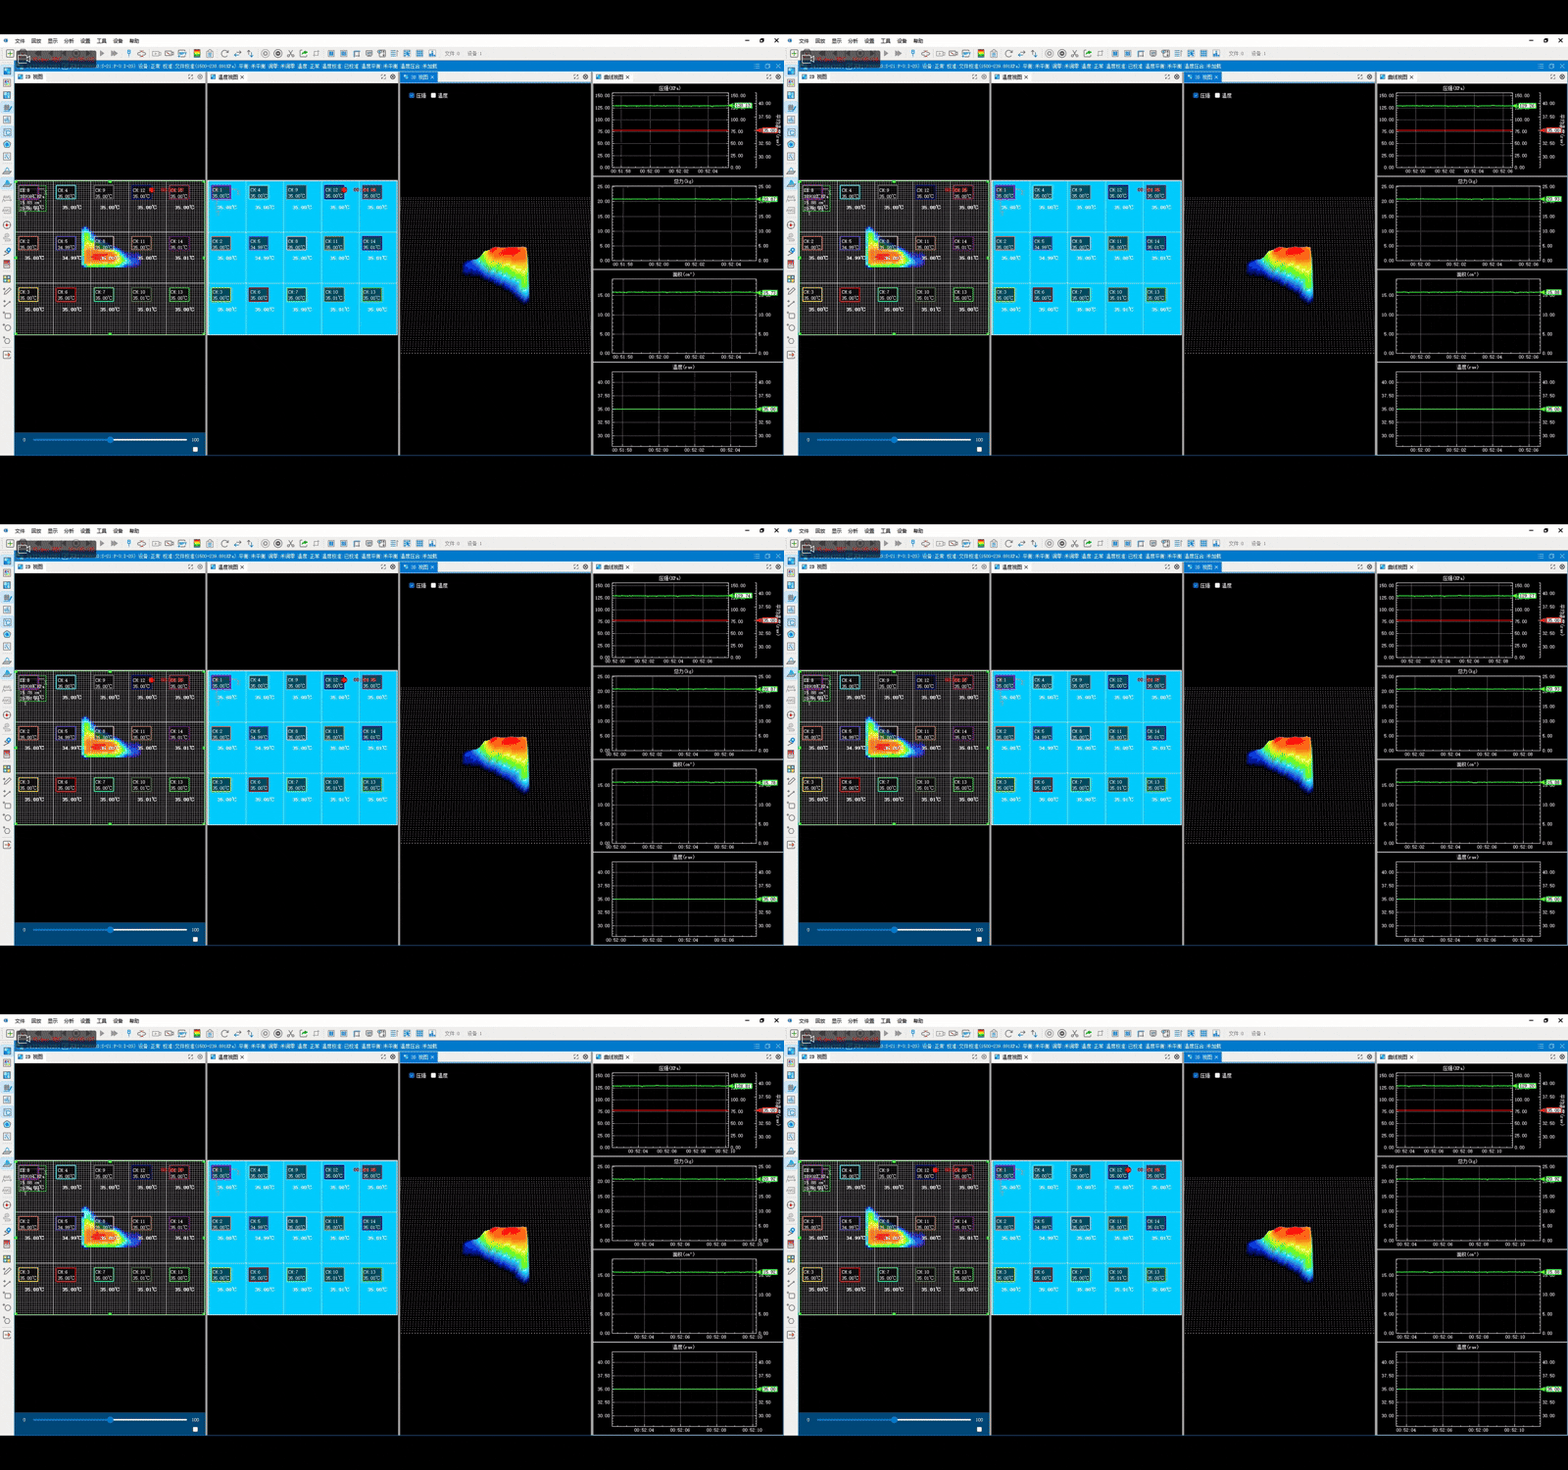
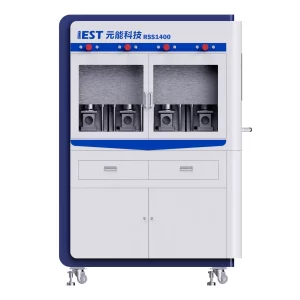
Introduction: The RSS1400 is a high-throughput, operando characterization platform specifically engineered for the rapid, multi-channel screening of expansion dynamics in silicon-based and graphite-based anodes. By integrating four-channel simultaneous in-situ swelling thickness tracking with independent pressure control, it delivers deep quantitative insights into cell volumetric dilation during dynamic charge-discharge cycling. It helps evaluate material and cell swelling performance with visual operation and one-click data export.
Features:
Four-channel Parallel Screening: Incorporates an integrated multi-channel testing architecture supporting independent or synchronous tracking of up to four cells, drastically multiplying high-throughput R&D validation velocity for swelling-prone silicon systems.
Operando Isobaric Pressure Profiling: Enables precise, continuous monitoring of anode thickness dilation under highly controlled, programmable pressure environments to simulate realistic cell mechanical constraints and aging conditions.
Adapt to in-situ testing of various battery cell structures: pouch cells, stacked configurations, laminates, and model coin-cells, etc.
Visual operation interface, one-click export of data report.
Application:
High-Throughput Volumetric Dilation Screening & Formulation Optimization for Silicon-based Anodes
Operando Swelling Characterization under Dynamic Pressures & Multi-Stage Cycling Regimes
Designing batteries that deliver optimal performance, extended cycle life and uncompromised safety requires a clear view of how pressure and temperature behave throughout development and manufacturing.
The IEST Battery Design Pressure Measurement System(BPD Series) integrates pressure and temperature sensors to supply engineers with high-accuracy, real-time interface maps and analytics — enabling faster process optimization and more reliable battery designs.
2. Why measure pressure & temperature in batteries?
During charging and discharging, electrodes, separators and cell housings undergo dimensional and thermal changes. If left unchecked, these effects can trigger problems such as:
Mechanical delamination and separator damage
Gas generation and swelling
Surface deformation and poor interfacial contact
Accelerated capacity fade and reliability loss
Elevated risk of thermal runaway
3. What real-time battery pressure mapping sensor delivers?
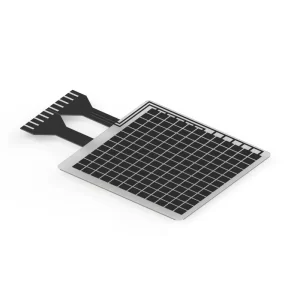
The IEST system provides dynamic, high-resolution visualization of surface pressure and temperature across cells, modules, and mechanical assemblies. Continuous pressure and temperature mapping produces reproducible, time-synchronized datasets.
With this visibility engineers can:
Ensure even stack compression across cells and modules
Minimize process variation during formation and assembly
Pinpoint high-stress or low-contact zones for corrective action
Monitor temporal trends and pressure drift over cycling
Capture pressure response during thermal excursions for safer fixture and pack design
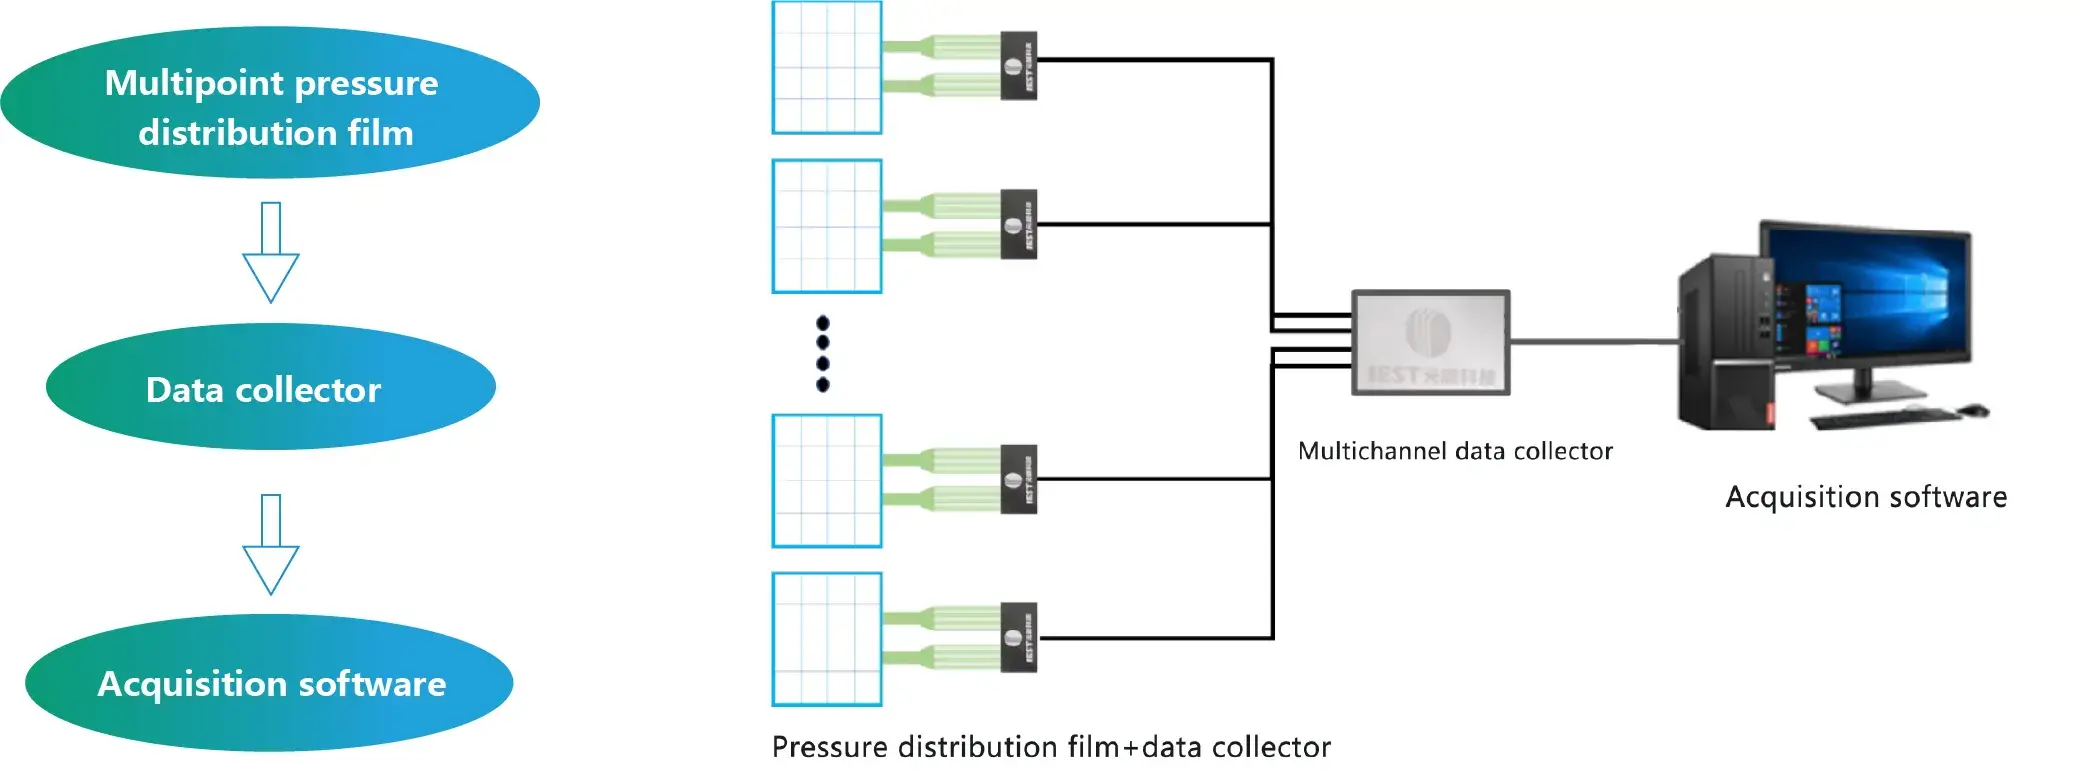
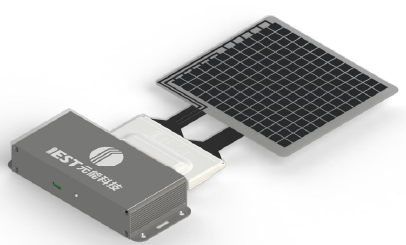
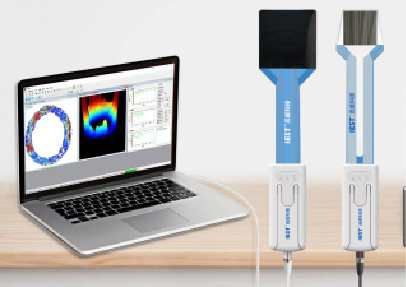
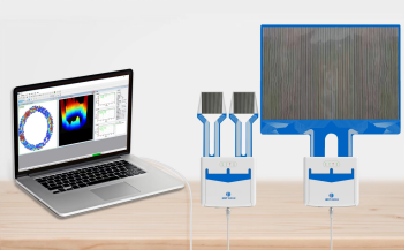
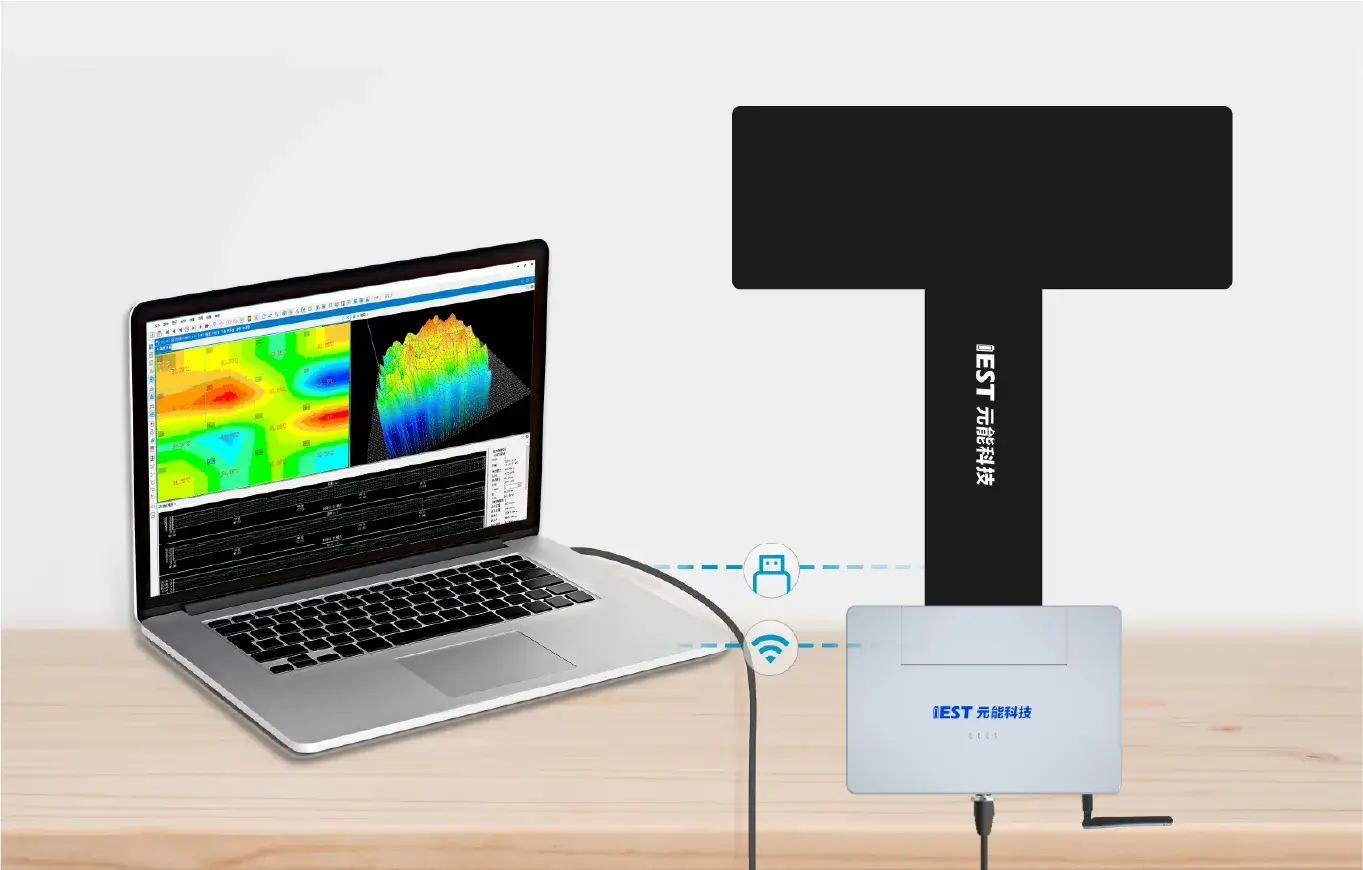
4. Structural Composition of Pressure Mapping Sensor Measurement System
5. Features
Capable of displaying real-time total force curves from all sensors versus time.
Flexible pressure-map selection and customizable sensing area to match coin cell, pouch cell, prismatic cell and module layouts.
Real-time synchronization with charge/discharge data to correlate electrochemical events with mechanical stress.
One-click to export the data report.
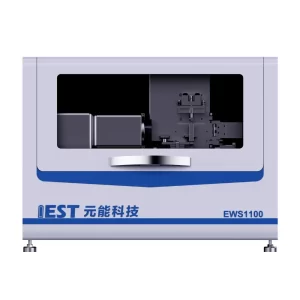
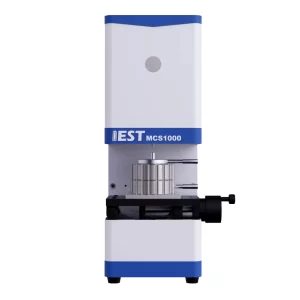
Real-time pressure calibration and optional integration with in-situ swelling fixtures for combined thickness/force studies.
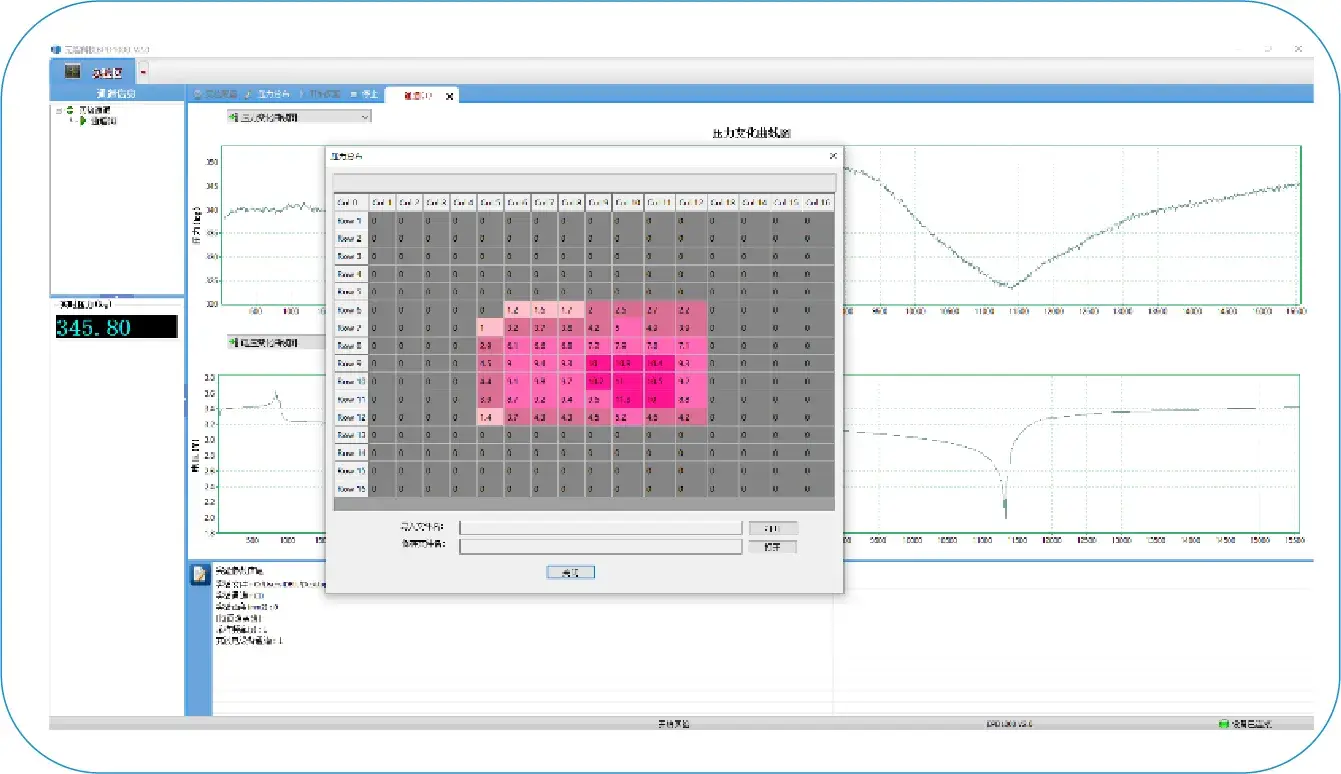
6. Software Interface
2D/3D topographic color mapping, contour visualization and per-region/time-domain analytics for fast interpretation.
Playback and slow-motion review of recorded tests, center-of-pressure tracking, and per-sensor numeric outputs for downstream modeling.
Open data export (CSV, common formats) and API support for integration with lab data systems and custom analysis pipelines.
Applications
Applications
With the swelling force test fixture or in-situ expansion test equipment, the pressure distribution at different positions on the surface of the cell during the cycling process is characterized.
Quickly and quantitatively evaluate the surface flatnessof the cell.
Pressure uniformity validation in hot press lamination processes
Rapid evaluation of lamination uniformity and module-level swelling forces distribution.
Cross-industry application(Customizable): Applicable for pressure distribution testing in non-battery industrial sectors.
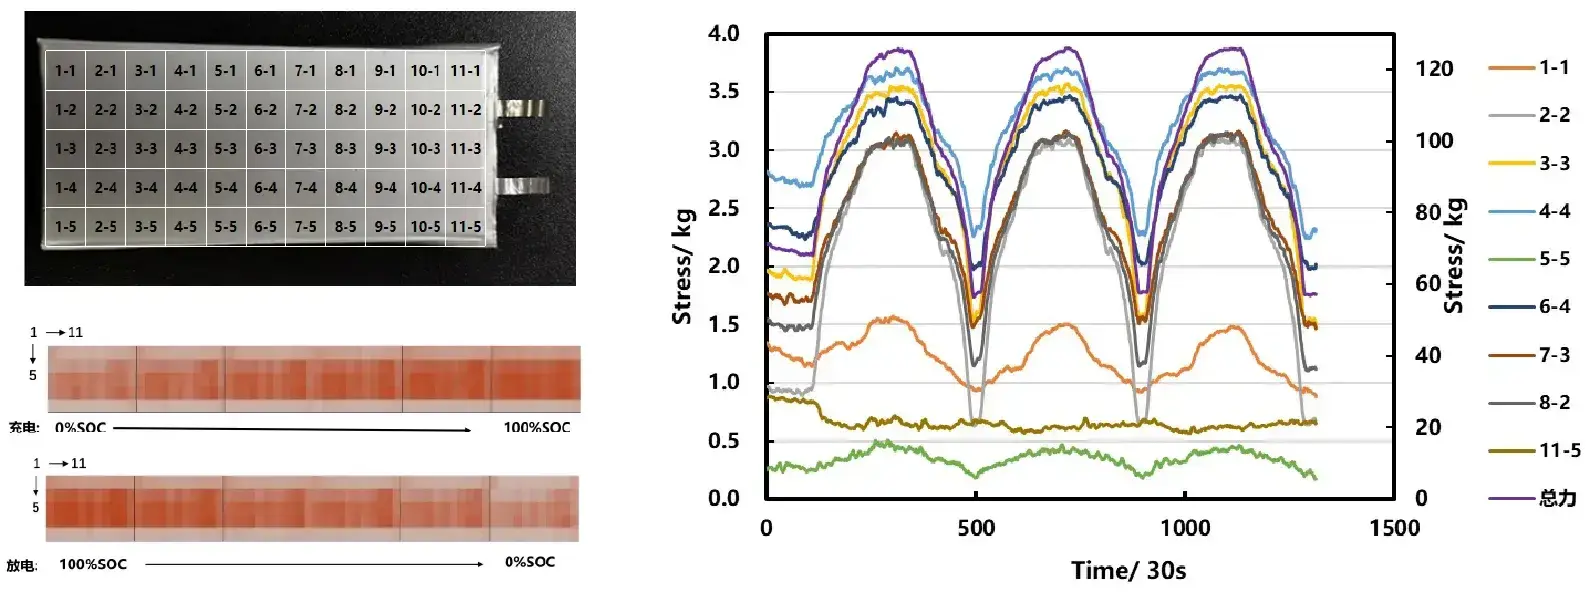
1. Battery Surface Pressure Distribution Testing During Cycling
Test information: NCM-Graphite system,3~4.3V, 0.5C, 50kg preload;
Result analysis: It can quantitatively characterize the difference of pressure distribution on the surface of the cell, provide a deeper perspective for the stress analysis of the cell, and help technicians analyze the pressure distribution in the battery cell, explore the causes of failure of the battery cell and develop a safer and more reliable cell.
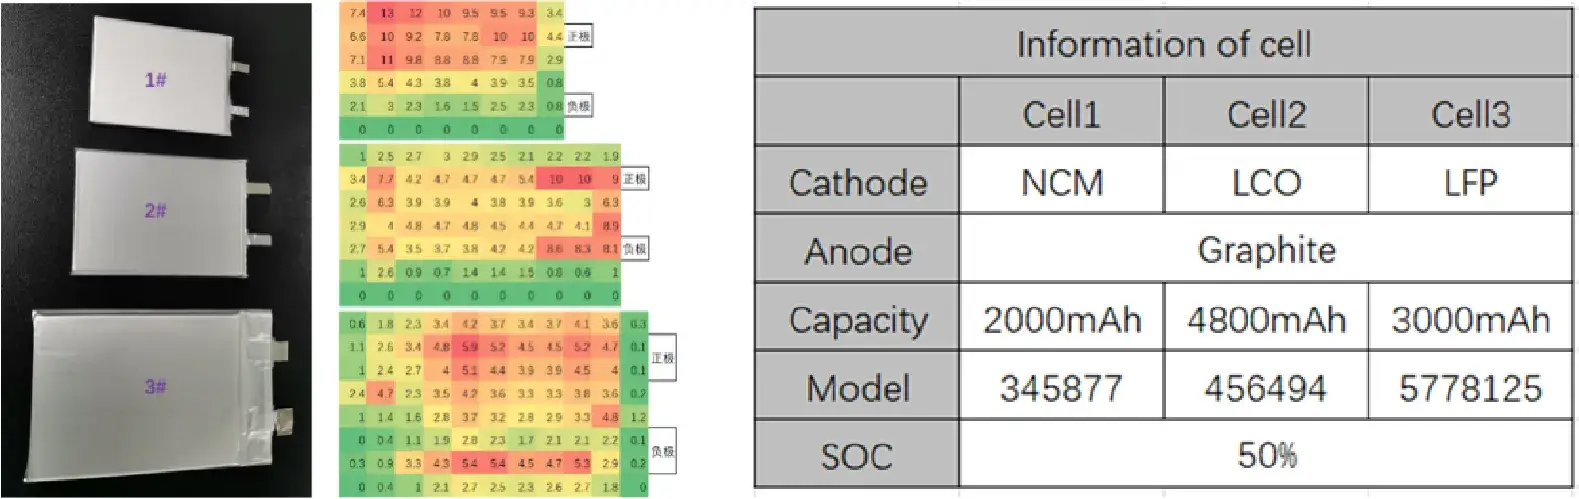
2. Surface Flatness Testing of Fresh Cells
Result analysis: there is a certain correlation between the cell process design and the cell pressure distribution(flatness). Technicians can develop appropriate distribution standards through the pressure distribution system to monitor the batch stability of the delivered cells.
3. Swelling Force Distribution
3.1 Pouch cell test
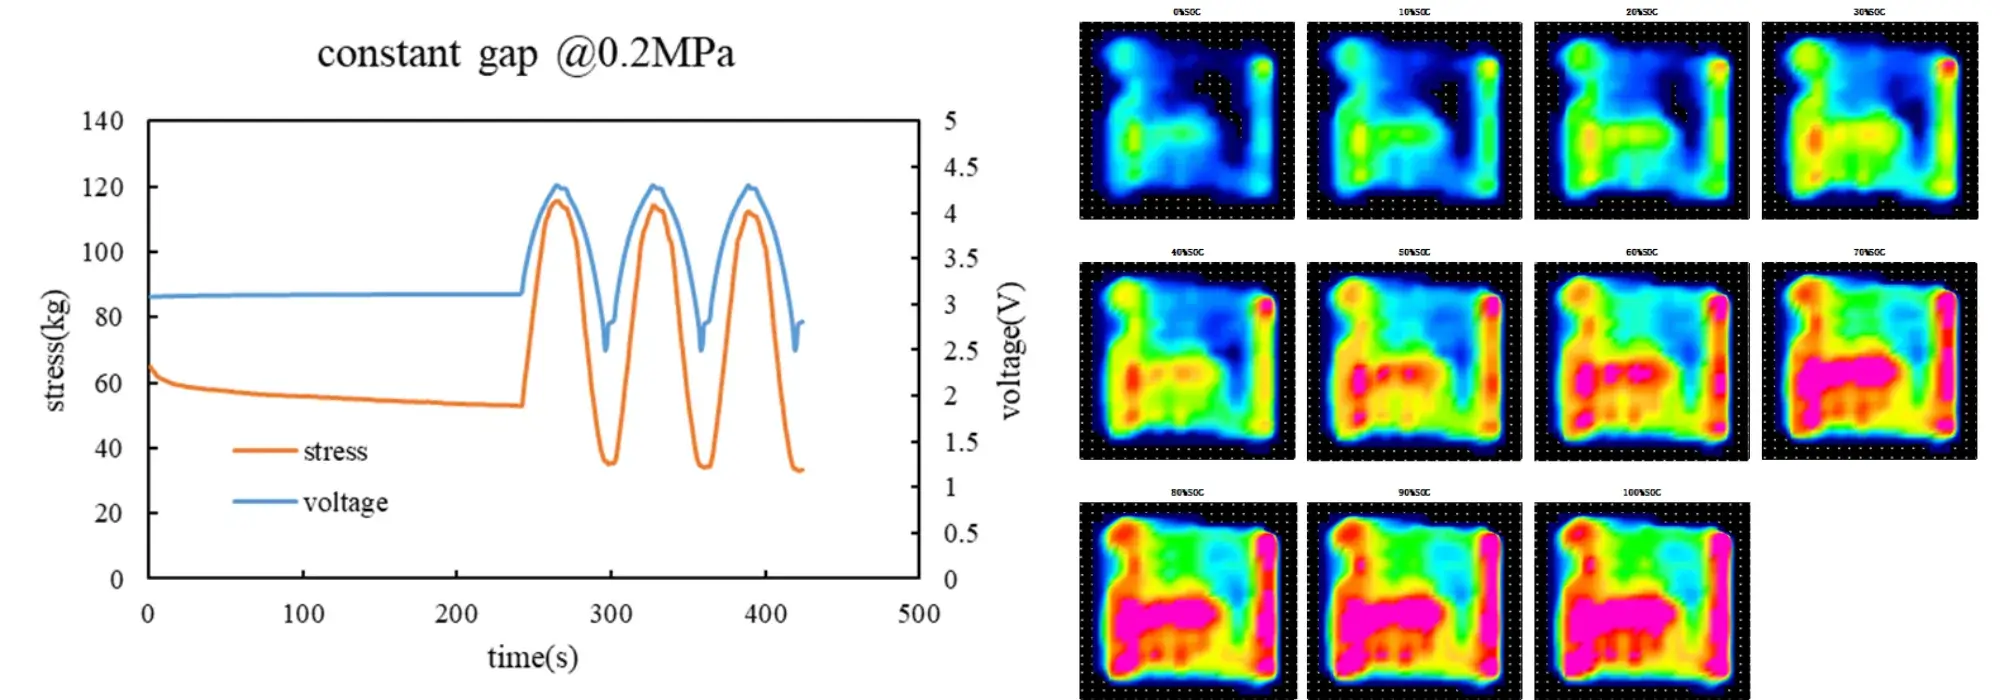
➤ Cell: 2 Ah ➤ Mode: constant gap
Cell: 2 Ah
Mode: Constant Gap
When used in conjunction with swelling equipment, it outputs the changes in expansion force while displaying the distribution at each stage.
3.2 Prismatic Cell Test
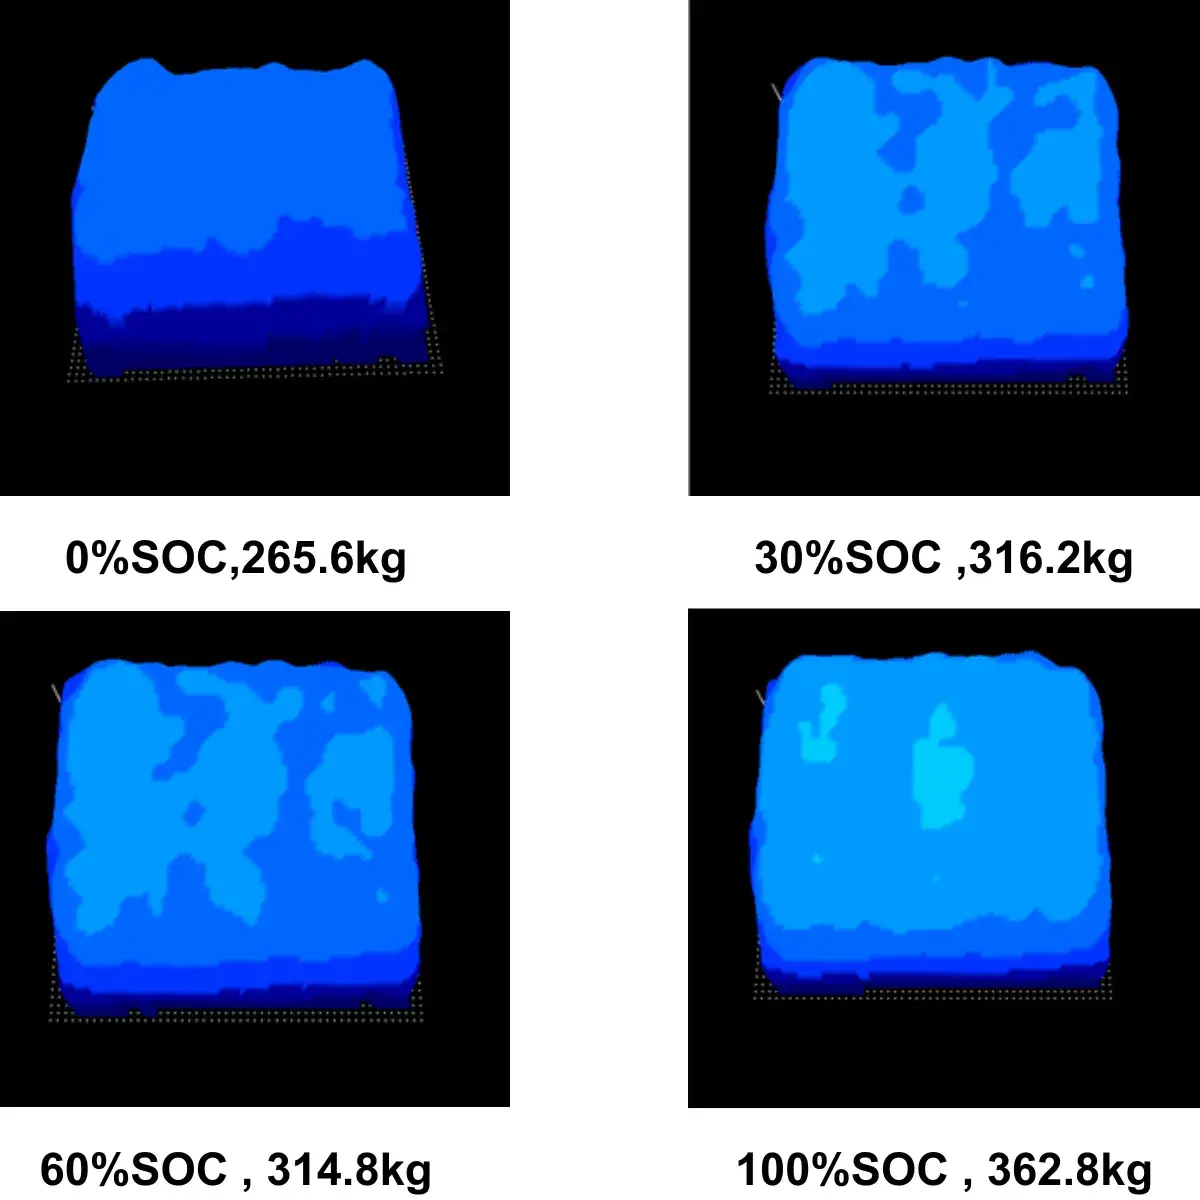
Cell: 334 Ah
Mode: Constant Gap
Configuration: Tested with Silicone Pad
Stress Uniformity: The addition of the silicone pad improves the overall force/stress distribution uniformity.
Force Relaxation Behavior: However, during the 30%–60% [SOC] stage, also influenced by the silicone pad, the measured force exhibits an unexpected decline instead.
4. Pressure and Temperature Distribution
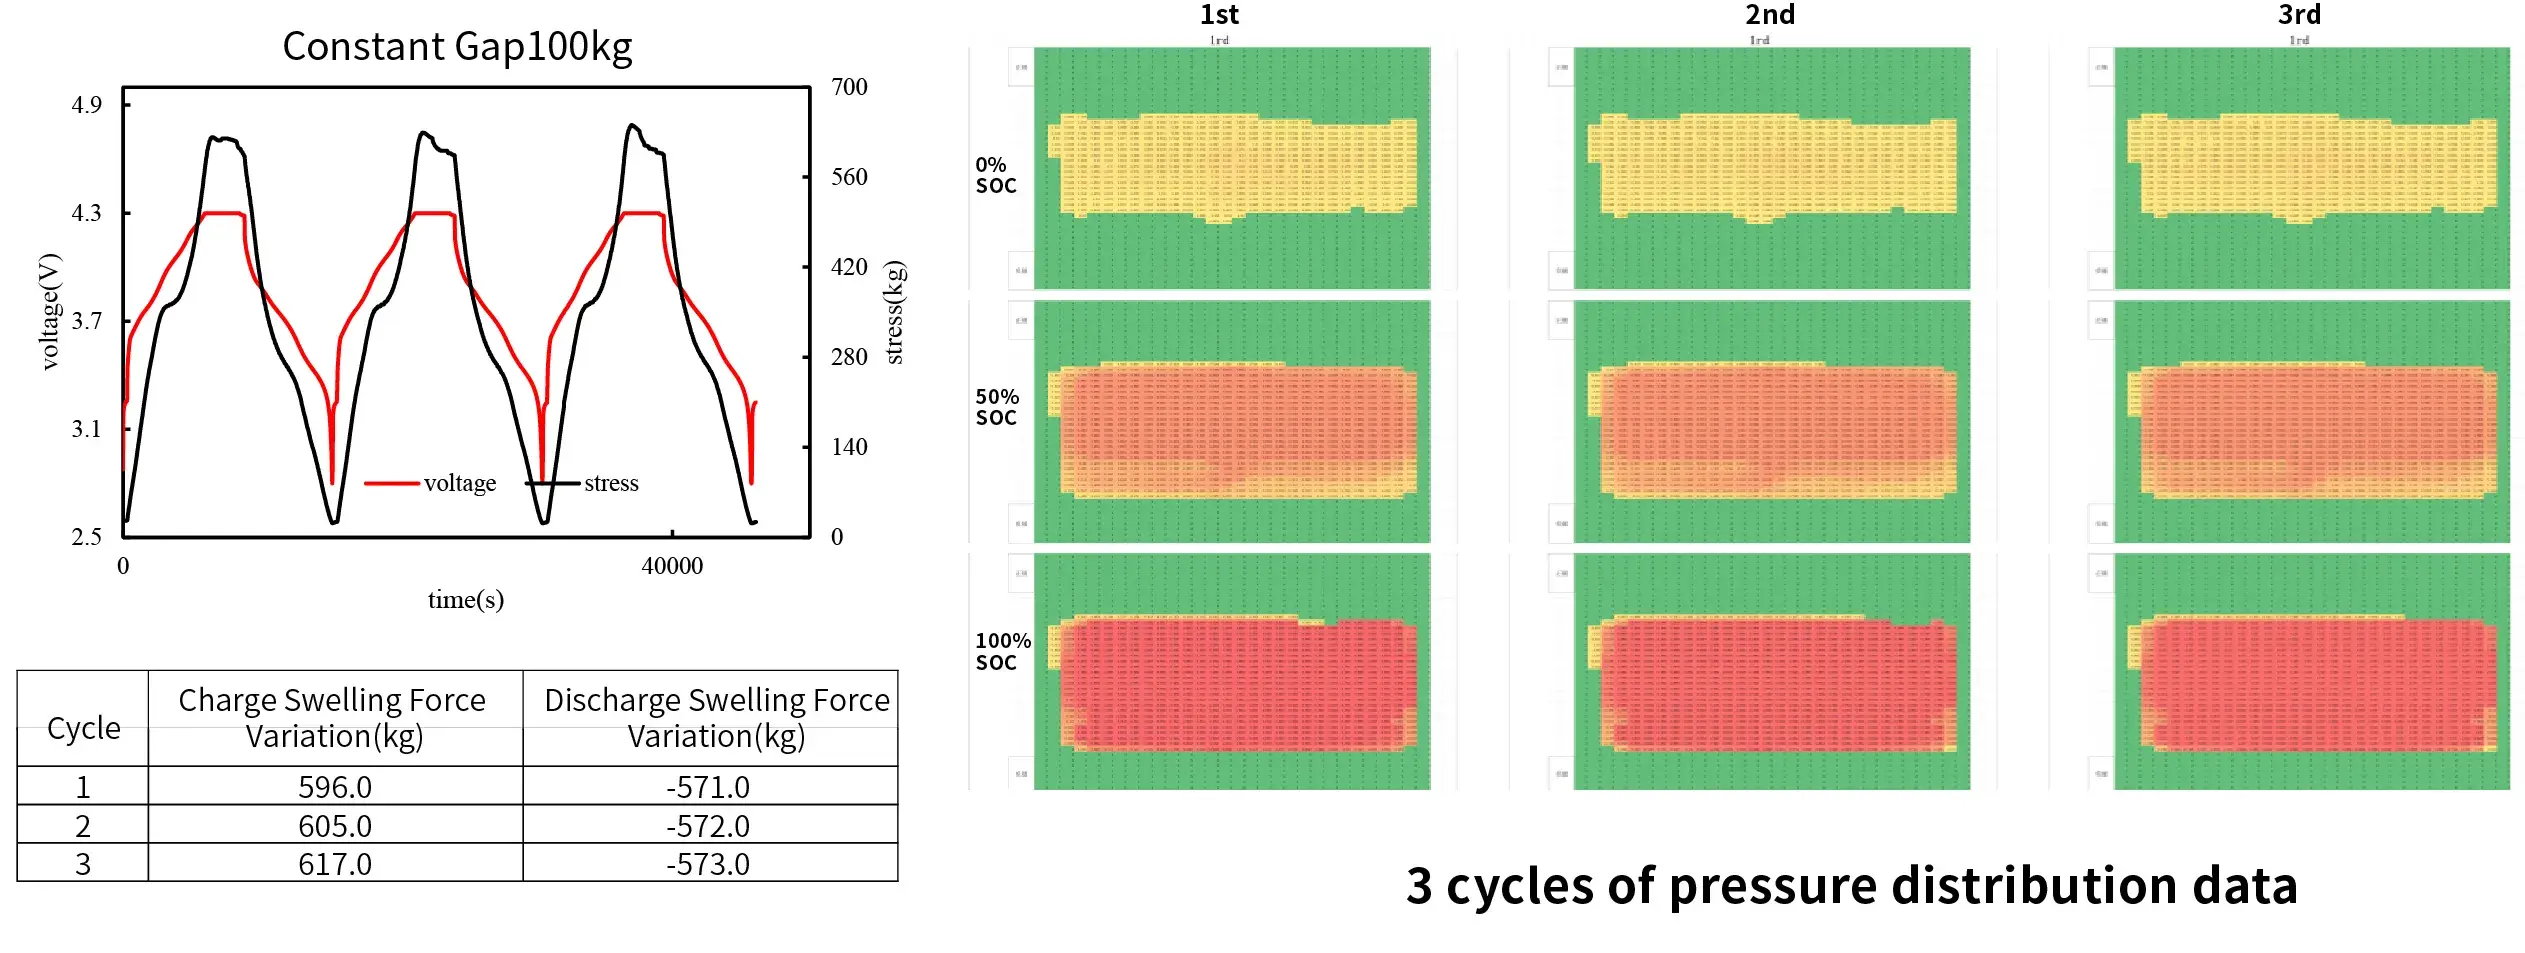
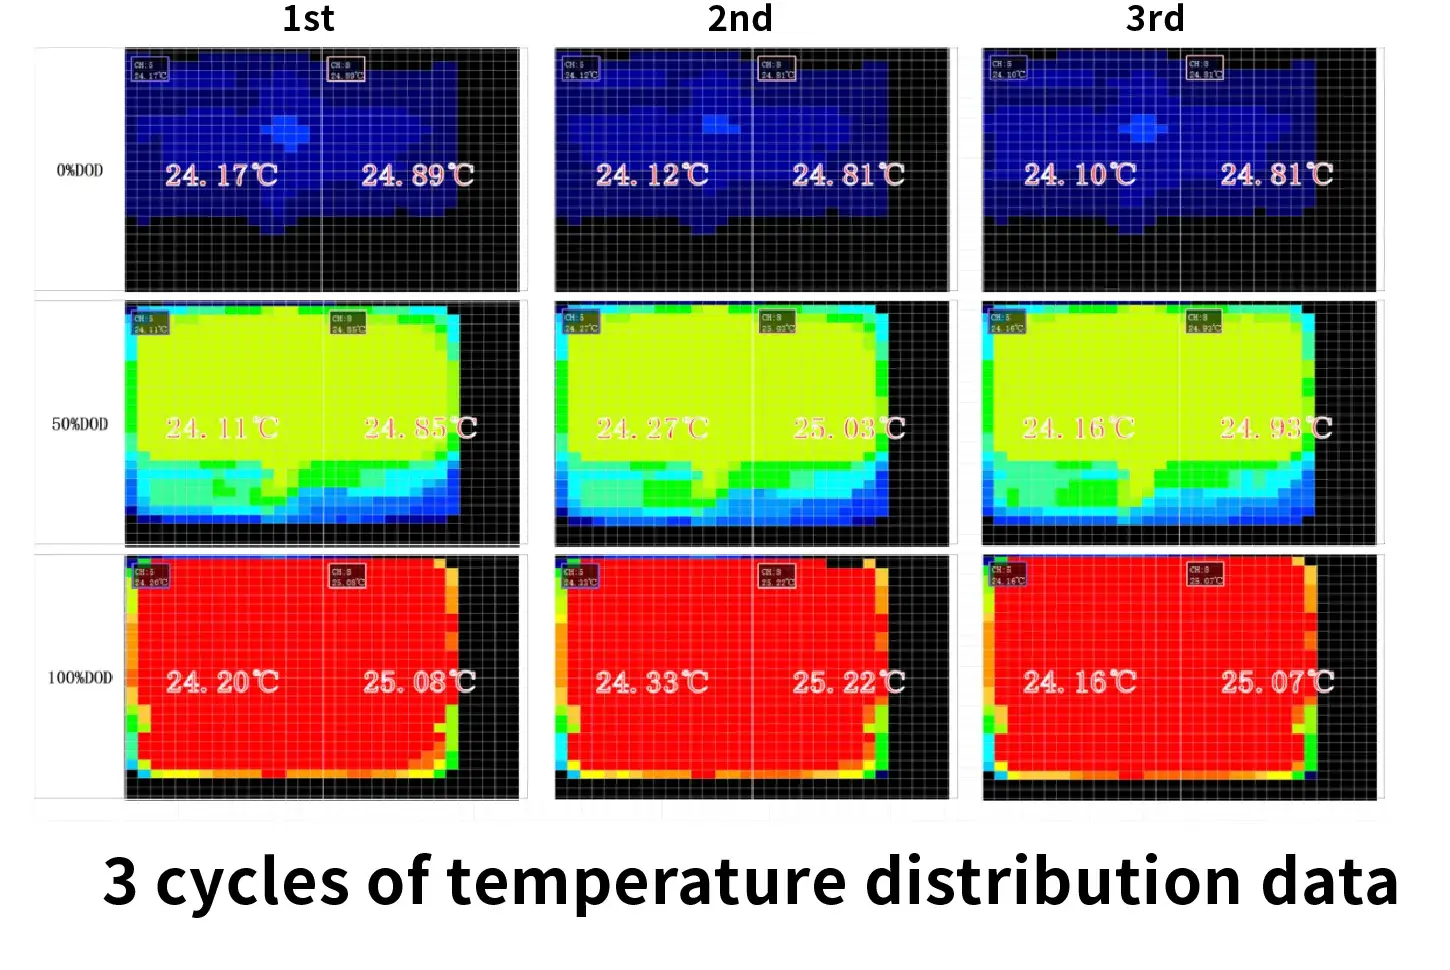
Sample: NCM/Gr Cell, 50 Ah, 0.5C CC/DC
Initial Preload Force: 100 kg
The test results were consistent after three cycles test, and the pressure distribution underdifferent SOC could be seen as well.
The test results were consistent after three cycles test,and the temperature distribution under different SOCcould be obtained.
Specifications
Model
BPD1000
BPD1100-M
BPD1100-L
BPD1100-T
Photo
Range (MPa)
0 ~ 5MPa(Other ranges can be customized)
0 ~ 2MPa, 0 ~ 3MPa, 0 ~ 5MPa(Other ranges can be customized)
0 ~ 2MPa, 0 ~ 3MPa, 0 ~ 5MPa, 0 ~ 10MPa(Other ranges can be customized)
Temperature Range
Not supported
-20 ~ 150°C
Temperature Accuracy
/
±1°C
Temperature Points
/
15 / 64
Points Supported
Individual sensing element size: 5 mm × 5 mm
Total point count is calculated based on required measurement area