

A research team led by Prof. Fan Xinming at Central South University and Prof. Yang Yong at Xiamen University investigated the chemo-mechanical degradation of LiNi₀.₉₂Co₀.₀₄Mn₀.₀₄O₂ (SC-N92) single-crystal Ni-rich cathodes cycled at elevated cutoff voltages. The study was published in Advanced Materials (DOI: 10.1002/adma.73901).
By combining atomic-resolution HAADF-STEM, geometric phase analysis (GPA), in-situ XRD, DFT calculations, molecular dynamics simulations, COMSOL modeling, and single-particle mechanical testing, the researchers linked lattice bending and phase reconstruction to localized stress and intragranular cracking. They identified an O3 → O1 → LiNi₂O₄ → Ni₃O₄ → rock-salt phase-evolution pathway and observed LiNi₂O₄, Ni₃O₄, and rock-salt structures in different crack regions. Ni₃O₄, with a Cmmm structure, was proposed as an unstable intermediate associated with restricted Li⁺ transport.
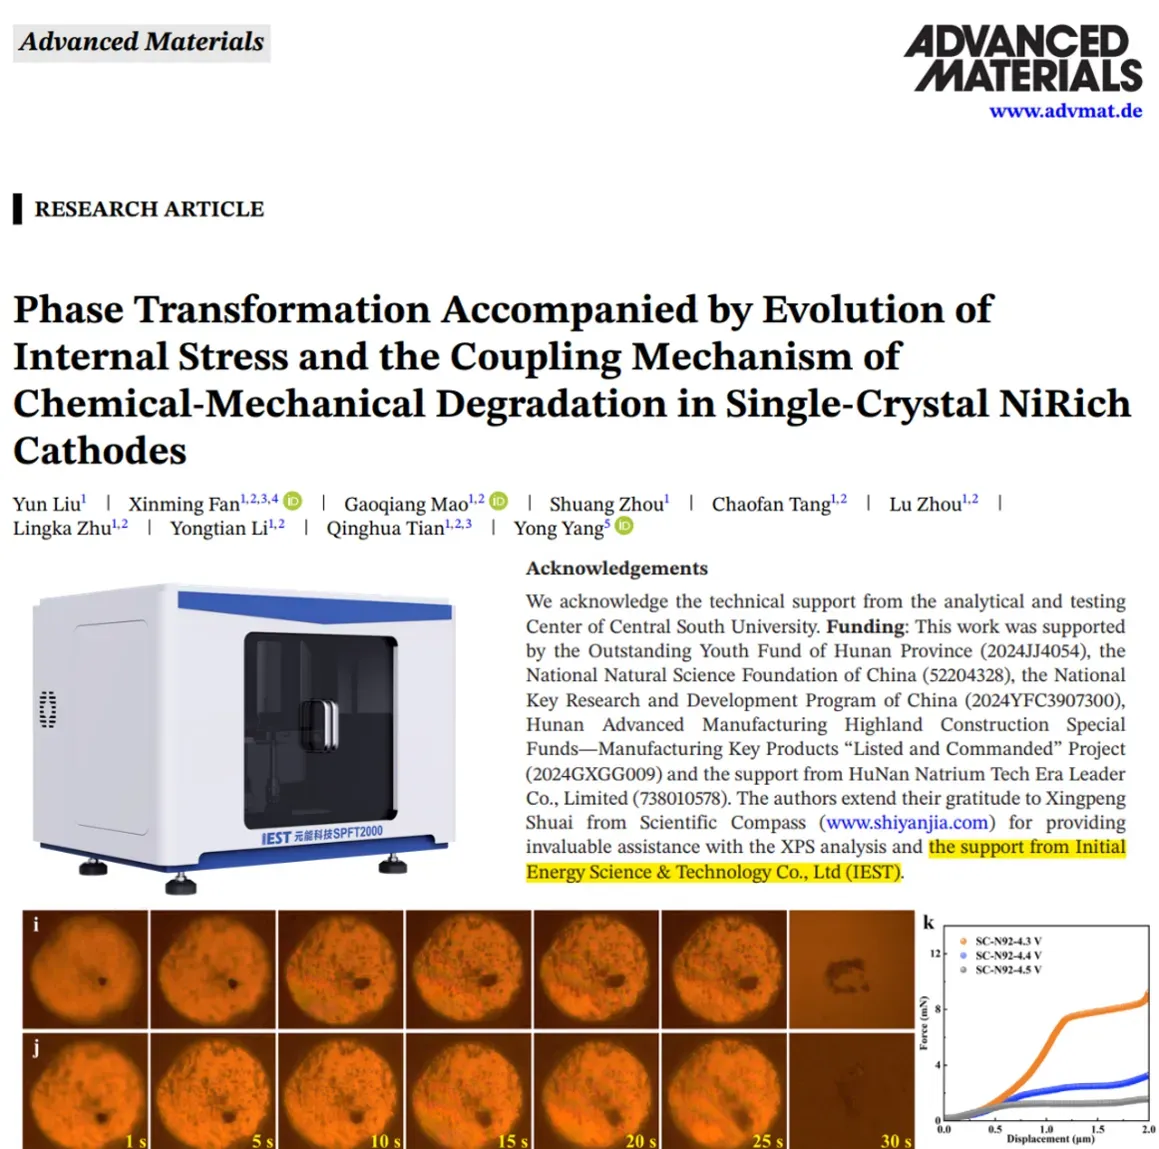
The IEST SPFT2000 Single-Particle Mechanical Testing System was used to compare the force response and fracture behavior of particles cycled to different cutoff voltages. These measurements showed that particles cycled to 4.3 V retained better resistance to mechanical failure than those cycled to 4.5 V.
📄 Source Paper
Yun Liu1, Xinming Fan1*, Gaoqiang Mao1, Shuang Zhou1, Chaofan Tang1, Lu Zhou1, Lingka Zhu1, Yongtian Li1, Qinghua Tian1, Yong Yang2*
DOI: 10.1002/adma.73901 | Journal: Advanced Materials | Institutions: Central South University, Xiamen University
✓ IEST SPFT2000 Single Particle Mechanical Properties Test System used in this research
Ultra-high-Ni layered oxide cathodes (LiNiₓCoᵧMn₁₋ₓ₋ᵧO₂, x ≥ 0.92) deliver exceptional specific capacity but suffer from accelerated capacity fade when operated at elevated cut-off voltages (≥4.3 V). Previous explanations have largely focused on the reconstruction of the layered surface into spinel- and rock-salt-like structures. The relationships among intermediate phases, lattice deformation, local stress, and crack formation, however, have remained less clearly defined.
Previous studies have faced two fundamental limitations: (1) polycrystalline samples introduce grain-boundary cracking as a confounding failure mode, obscuring the intrinsic lattice-level mechanisms; and (2) ex-situ characterization captures only the final degradation state, missing the transient intermediate phases that reveal the thermodynamic and kinetic pathway. The multi-step phase transition pathway in single-crystal NCM cathode materials has therefore remained incompletely defined — until this study.
The study combined electrochemical testing, structural characterization, particle-level mechanical measurements, spectroscopy, and multiscale simulation:
A multi-scale characterization suite was deployed:
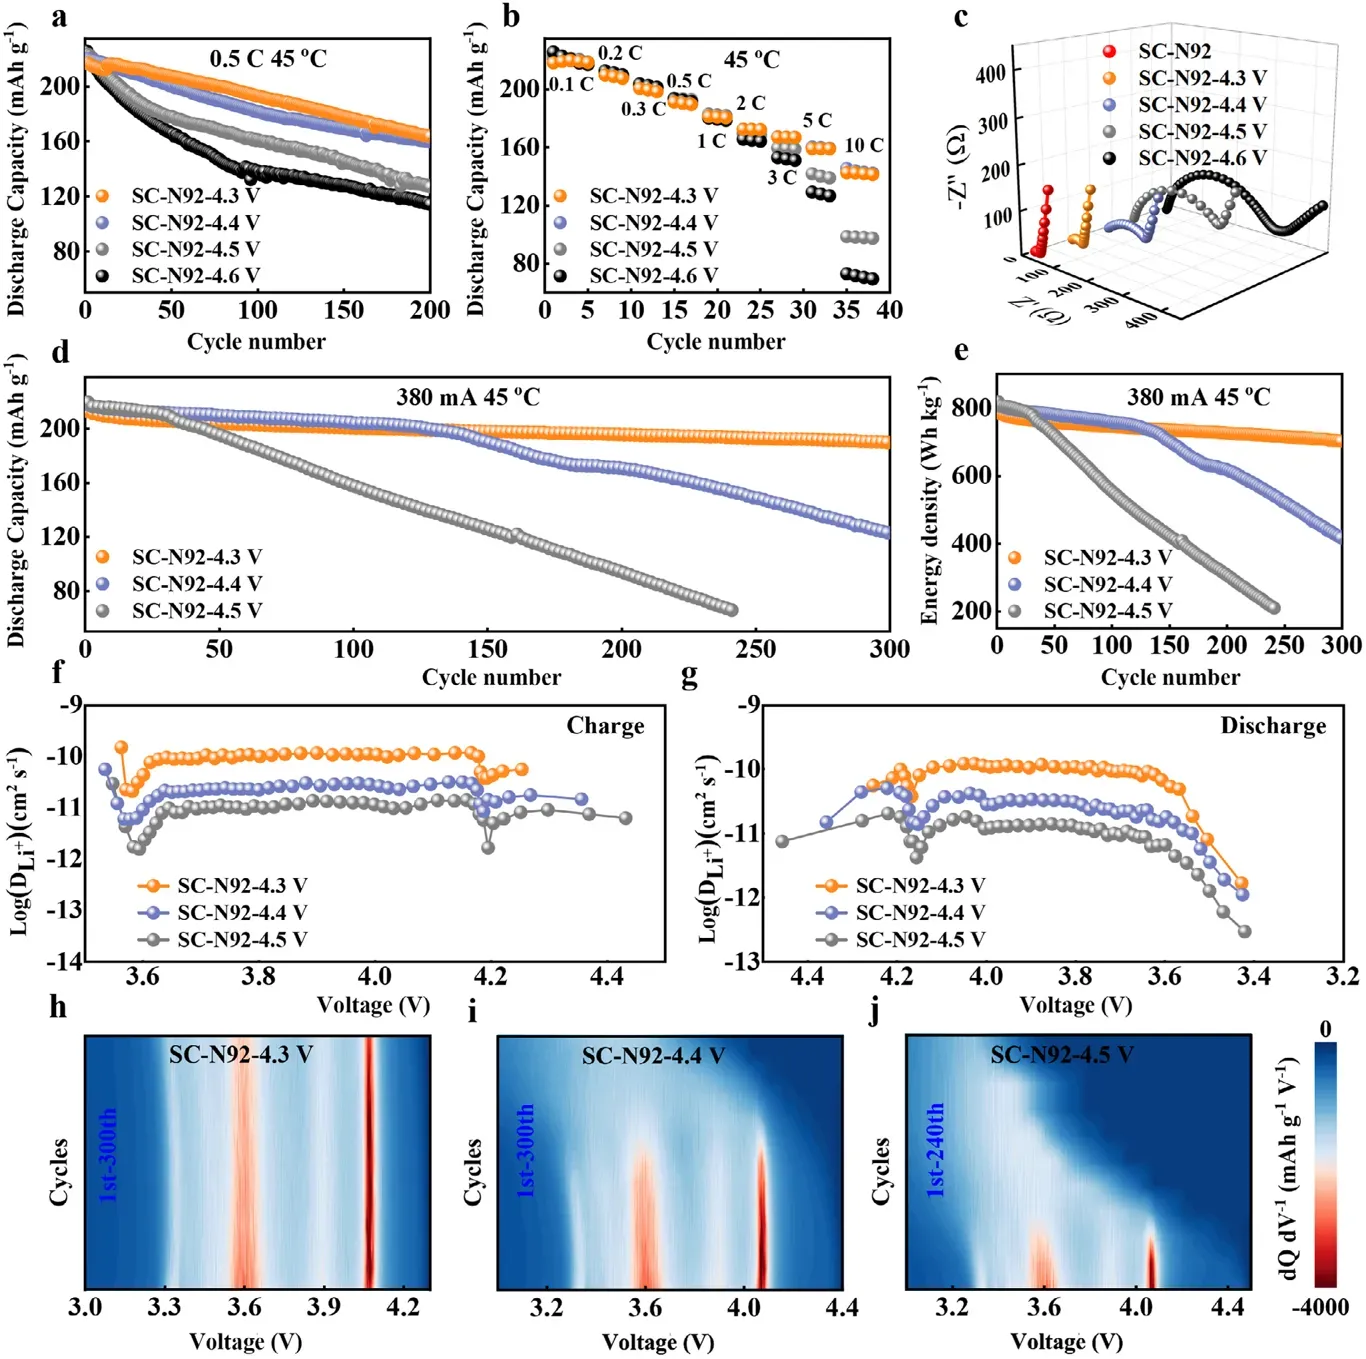
Figure 1. Electrochemical data in half/fullcells for SC-N92 at 45°C. (a) Cycling performance in half cells, (b) Rate performance. (c) EIS Nyquist plots before cycling and after 200 cycles within the voltage range of 4.3-4.6V. (d) Cycling performance in pouch-type full cells, (e) Corresponding energy density, GITT diagrams during (f) charge and (g) discharge processes, (h-j) dQ/dV contour diagrams with a cut-off voltage window of 4.3-4.5V at 45°C.
| Parameter | IEST SPFT2000 Spec | Relevance to This Study |
|---|---|---|
| Force Range | 0–100 mN / 0–500 mN | Covers SC-N92 particle fracture force range across all degradation states |
| Force Accuracy | ±0.01 / ±0.05 mN | Resolves subtle strength differences between particles cycled at 4.3V vs 4.5V |
| Displacement Resolution | 10 nm | Captures pre-fracture lattice-level deformation signatures |
| Magnification | 1200× | Verifies particle morphology and pre-existing crack features before testing |
| Standard | GB/T 43091-2023 | Provides standardized, reproducible methodology for cross-study comparison |
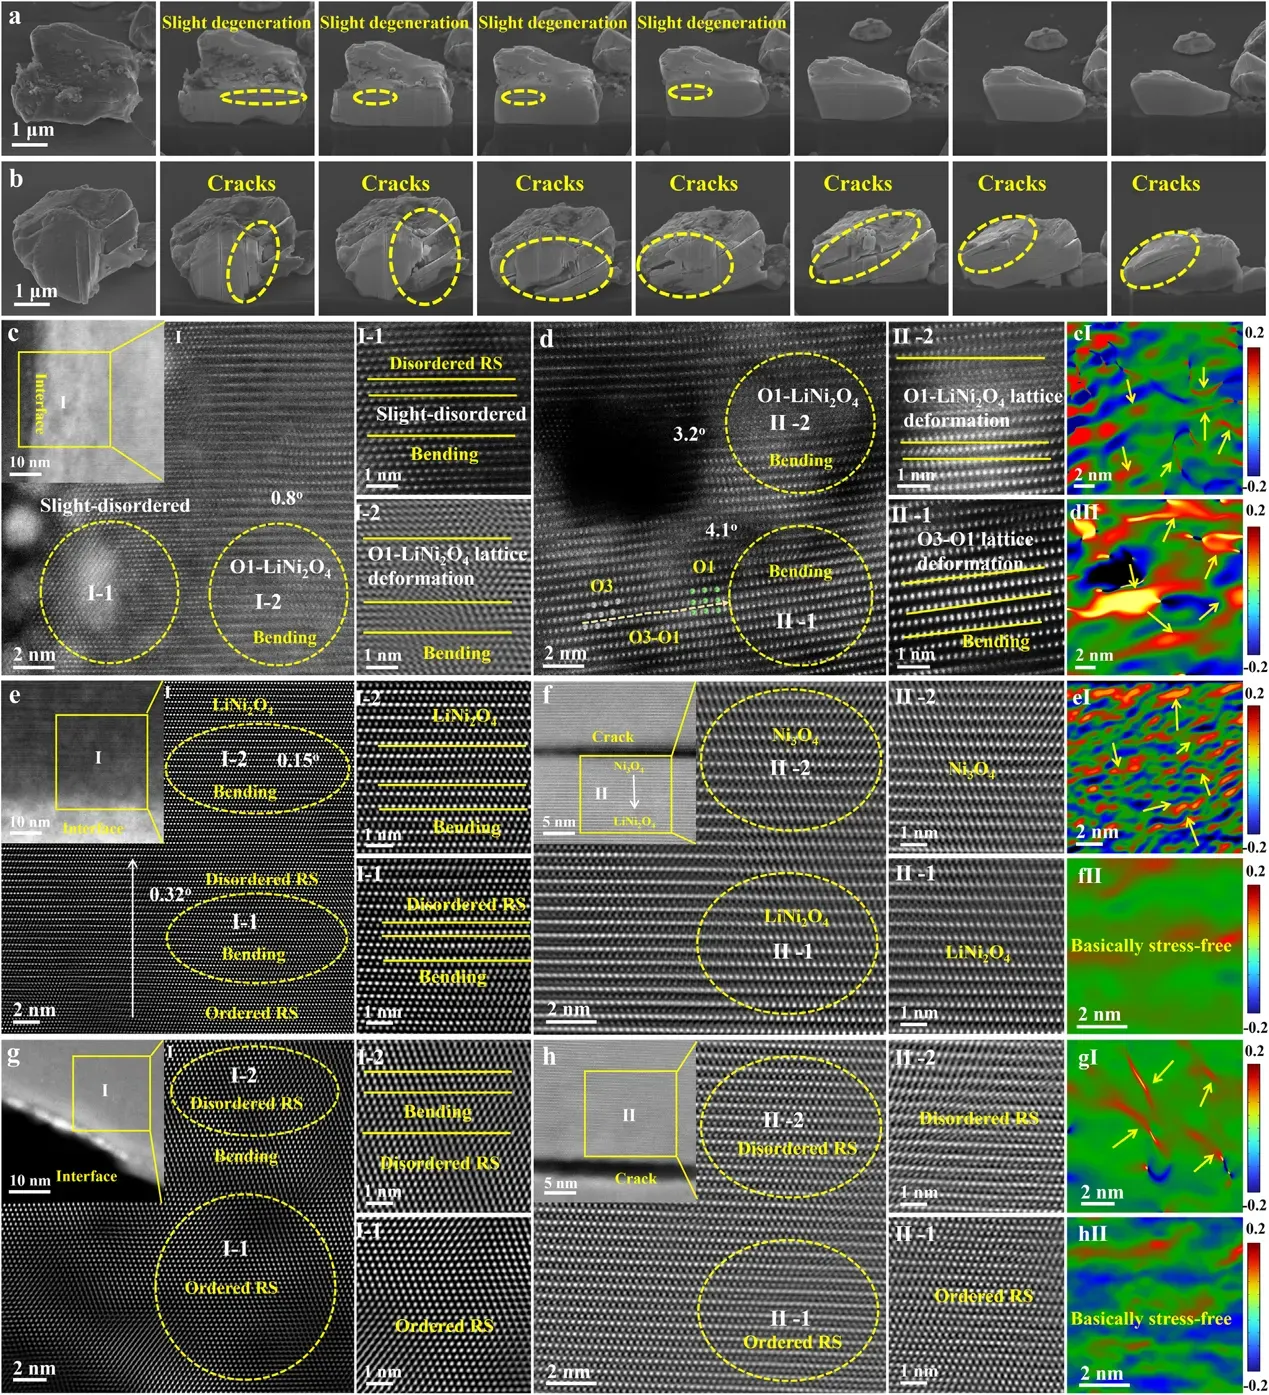
Figure 2. Morphology and crystal structure for cathode in pouch-type full cells at 45°C after 300 cycles.
Atomic-resolution HAADF-STEM imaging combined with GPA strain analysis revealed that lattice bending induced stress concentration is the primary trigger — not a secondary consequence — of phase degradation. Bending regions exhibit concentrated elastic strain that: (1) distorts the oxygen framework, facilitating transition-metal migration from octahedral to tetrahedral sites; (2) locally increases the c-axis lattice parameter, destabilizing the layered O3 structure; and (3) creates a positive-feedback loop where initial phase transformation further amplifies local stress, accelerating subsequent transformation steps.
The O3→O1→LiNi₂O₄→Ni₃O₄→rock-salt degradation chain uncovered in this study represents the first complete mapping of the transformation pathway in ultra-high-Ni cathodes.
| Phase | Space Group | Li+ Transport | Role in Degradation Chain | Detection Location |
|---|---|---|---|---|
| O3 Layered | R-3m | Fast 2D channels | Initial layered structure | Particle interior (undamaged) |
| O1 Distorted | P-3m1 | Slowed | First degradation product; forms at lattice bending sites; precursor to spinel nucleation | Bending regions; crack vicinity |
| LiNi2O4 Spinel |
Fd-3m | Severely impaired | Intermediate reconstruction associated with transition-metal migration | Crack walls; phase boundaries |
| Ni3O4 ★ | Cmmm | Nearly blocked | Key finding: unstable intermediate observed in reconstructed and cracked regions | High-voltage crack regions only |
| Rock-Salt (NiO-like) |
Fm-3m | Electrochemically dead | Final degradation product; irreversible; accumulates with cycling | Crack surfaces; particle exterior |
The microscopy results showed that crack-associated reconstruction cannot be described solely as rock-salt formation. LiNi₂O₄ (Fd-3m), Ni₃O₄ (Cmmm), and ordered or disordered rock-salt structures (Fm-3m) were identified in different surface and internal crack regions. EDS line scans across crack walls show a Ni/O ratio gradient consistent with progressive oxygen loss along the degradation chain, with Ni₃O₄ representing an intermediate stoichiometry between LiNi₂O₄ and NiO.
DFT and MD simulation for cathode phase transition kinetics provided the quantitative rationale: Ni₃O₄ exhibits a Li⁺ migration barrier that is approximately 3× higher than that of the O3 phase, effectively blocking the two-dimensional diffusion channels. The Cmmm orthorhombic structure lacks the continuous octahedral-vacancy network required for facile Li⁺ hopping, making even a thin Ni₃O₄ layer at crack walls a potent barrier to lithium transport.
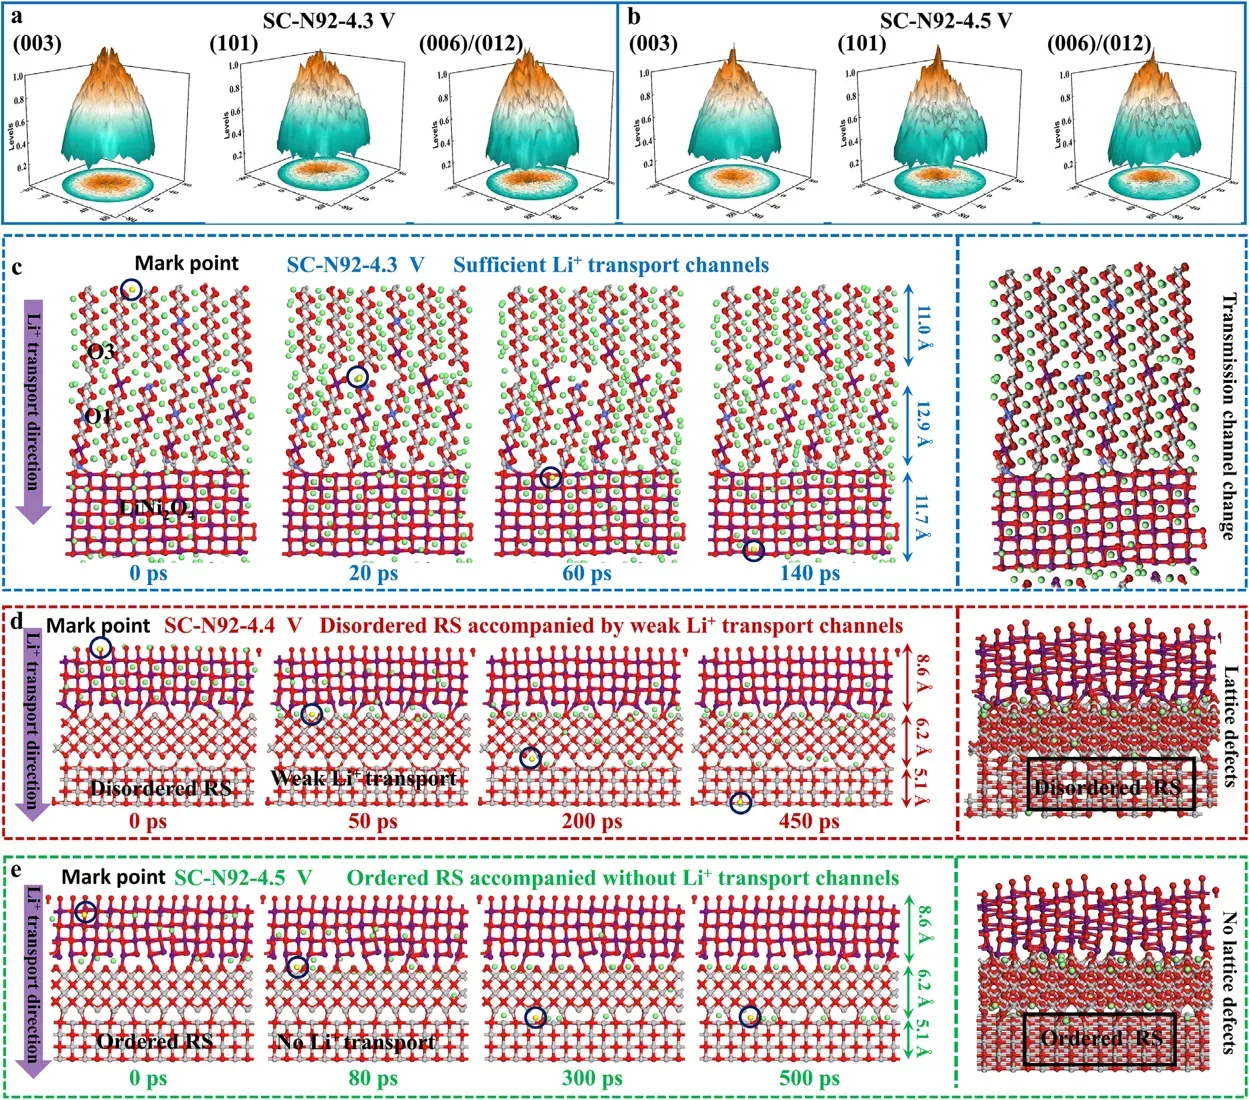
Figure 3. XRD poles and molecular dynamics simulation for cathode in pouch-type full cells at 45°C after 300 cycles.
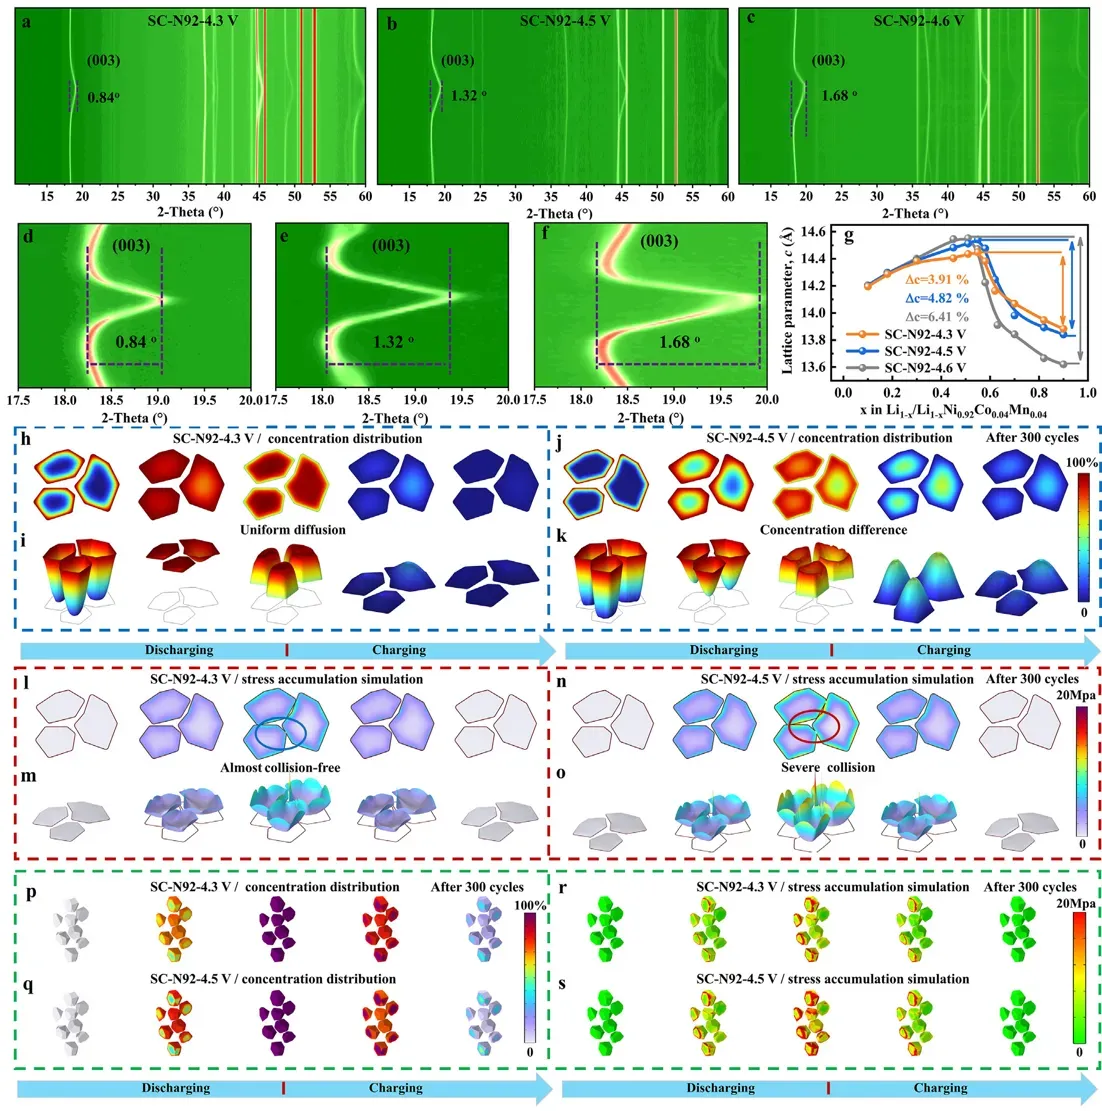
Figure 4. In-situ XRD analysis in the first cycle and COMSOL modeling in pouch-type full cells at 45°C after 300 cycles.
In-situ XRD monitoring during charge/discharge (Figure 4) quantified the c-axis lattice contraction and anisotropic strain in Ni-rich cathodes as a function of voltage. At a cut-off of 4.3V, the maximum c-axis contraction was limited to 3.91%, and the H2→H3 phase transition remained fully reversible — upon relithiation, the lattice recovered its original dimensions with no detectable residual strain. At 4.6V, contraction reached 6.41% — a 64% increase — and the H2-H3 irreversible phase transition in high-voltage NCM was triggered: the (003) diffraction peak showed permanent broadening and position shift after the first delithiation/lithiation cycle, indicating that the layered structure could not fully recover its original orientation and interlayer spacing.
This irreversibility is the structural root cause of the observed voltage and capacity fade: each high-voltage cycle introduces a small but permanent lattice disordering that accumulates over hundreds of cycles, progressively degrading the crystallographic template required for facile two-dimensional Li⁺ diffusion.
COMSOL Multiphysics Simulation provided the engineering-scale validation of these atomic-scale findings. The model coupled lithium concentration diffusion with mechanical stress generation, simulating the evolution of Li⁺ distribution and von Mises equivalent stress within an SC-N92 particle after extended cycling. At 4.3V, the simulation showed a relatively uniform Li⁺ concentration profile from the particle surface to the core, with moderate and evenly distributed von Mises stress. At 4.5V, a dramatically different picture emerged: a steep Li⁺ concentration gradient developed between the particle surface (near-fully delithiated) and the interior (partially lithiated). This gradient generated a correspondingly non-uniform stress field with stress concentrations at the phase-boundary regions where lattice parameters differed most sharply. The simulation directly demonstrates how the high-voltage phase transitions create self-amplifying mechanical stress that drives the progressive particle cracking observed in FIB-SEM — perfectly consistent with the stress-chemical coupling induced cathode particle fracture model.
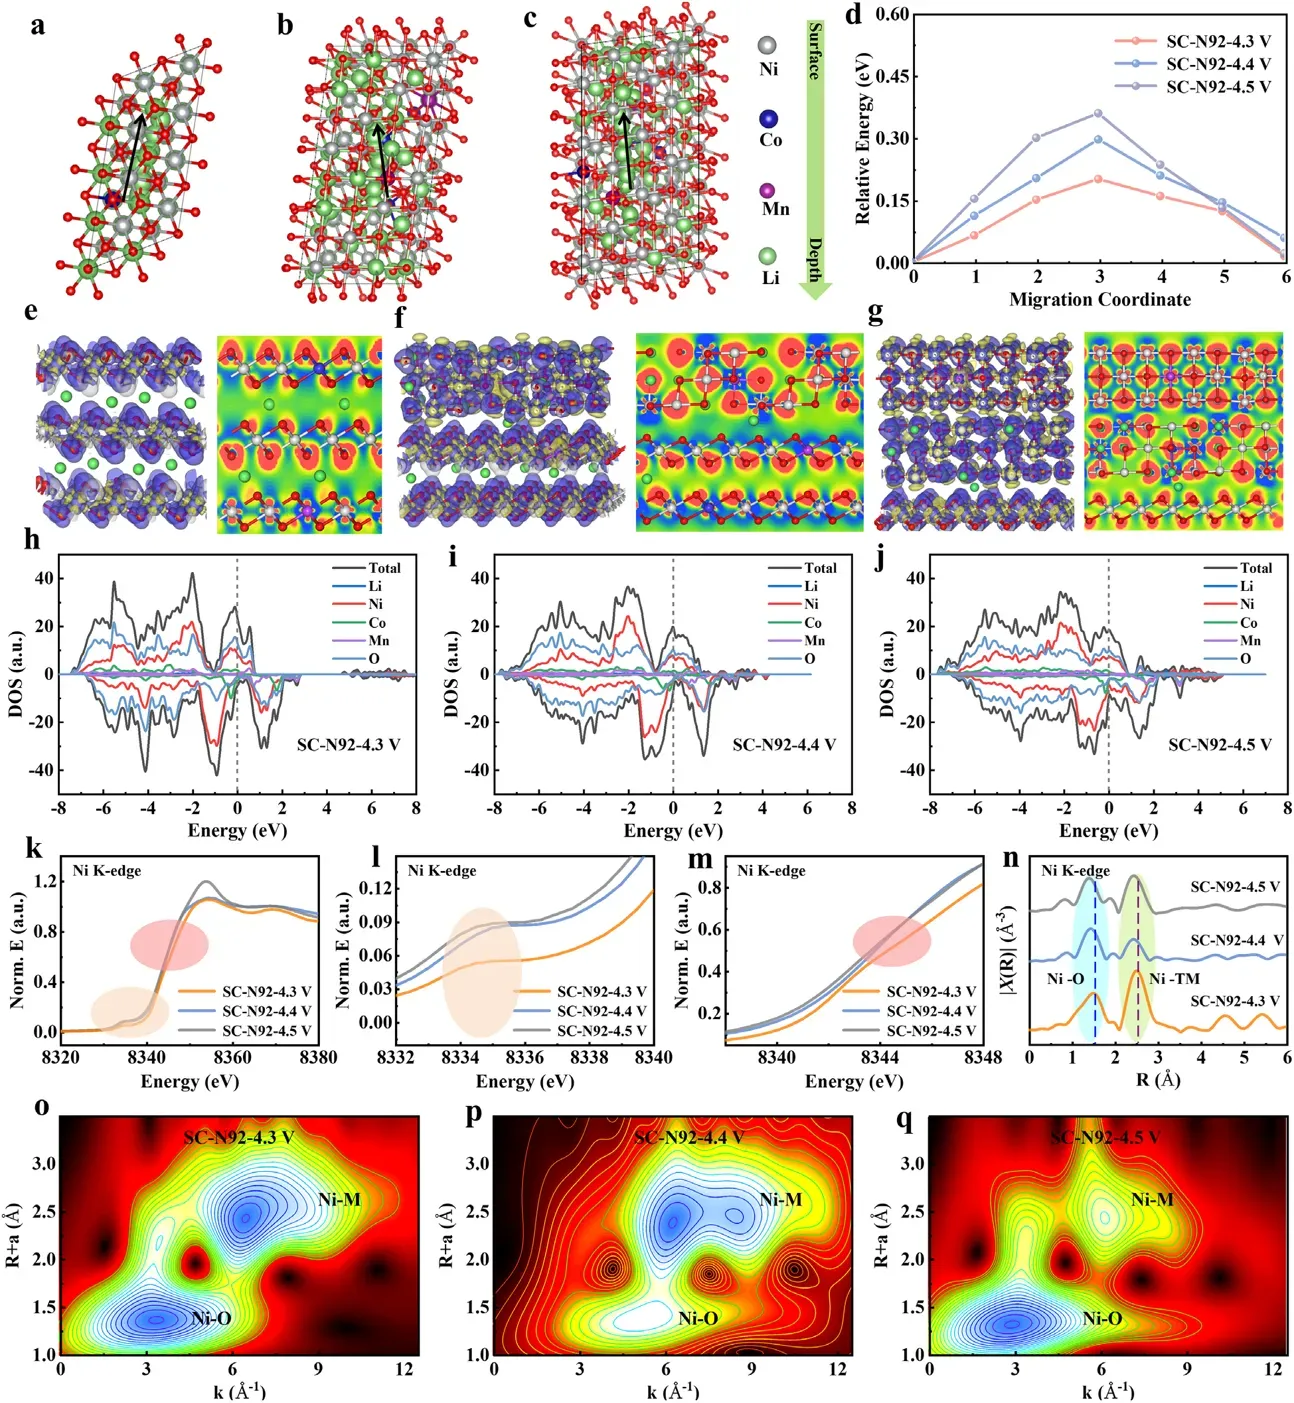
Figure 5. (a–d) DFT first-principles calculations: density of states (DOS), charge density difference, Li⁺ migration energy barriers, and COHP bond analysis across O3, O1, LiNi₂O₄, Ni₃O₄, and rock-salt phase interfaces. (e–g) XANES, EXAFS, and wavelet transform (WT) of the Ni K-edge for SC-N92 cycled at 4.3V and 4.6V.
DFT and MD simulation for cathode phase transition kinetics provided the electronic-structure explanation for the observed degradation. Across the five-phase chain, DFT calculations revealed a progressive deterioration of electronic and ionic transport properties:
XANES and EXAFS spectroscopy at the Ni K-edge (Figure 5e–g) provided the experimental validation. After cycling at 4.3V, the XANES white-line position and EXAFS Fourier transform confirm that a high proportion of electrochemically active Ni³⁺/Ni⁴⁺ is maintained, with Ni–O bond lengths close to the pristine values. In stark contrast, the 4.6V-cycled sample shows: (1) a pronounced shift of the absorption edge to lower energy — indicating substantial reduction of Ni³⁺/Ni⁴⁺ to inactive Ni²⁺; (2) EXAFS fitting reveals shortened Ni–O bond lengths in the first coordination shell, consistent with the formation of rock-salt-like local environments; and (3) wavelet transform analysis shows the disappearance of the characteristic second-shell Ni–TM scattering peak, indicating severe disruption of the layered ordering. These spectroscopic signatures directly corroborate the DFT prediction that high-voltage cycling drives irreversible electronic and structural degradation through the multi-stage phase transition cascade.
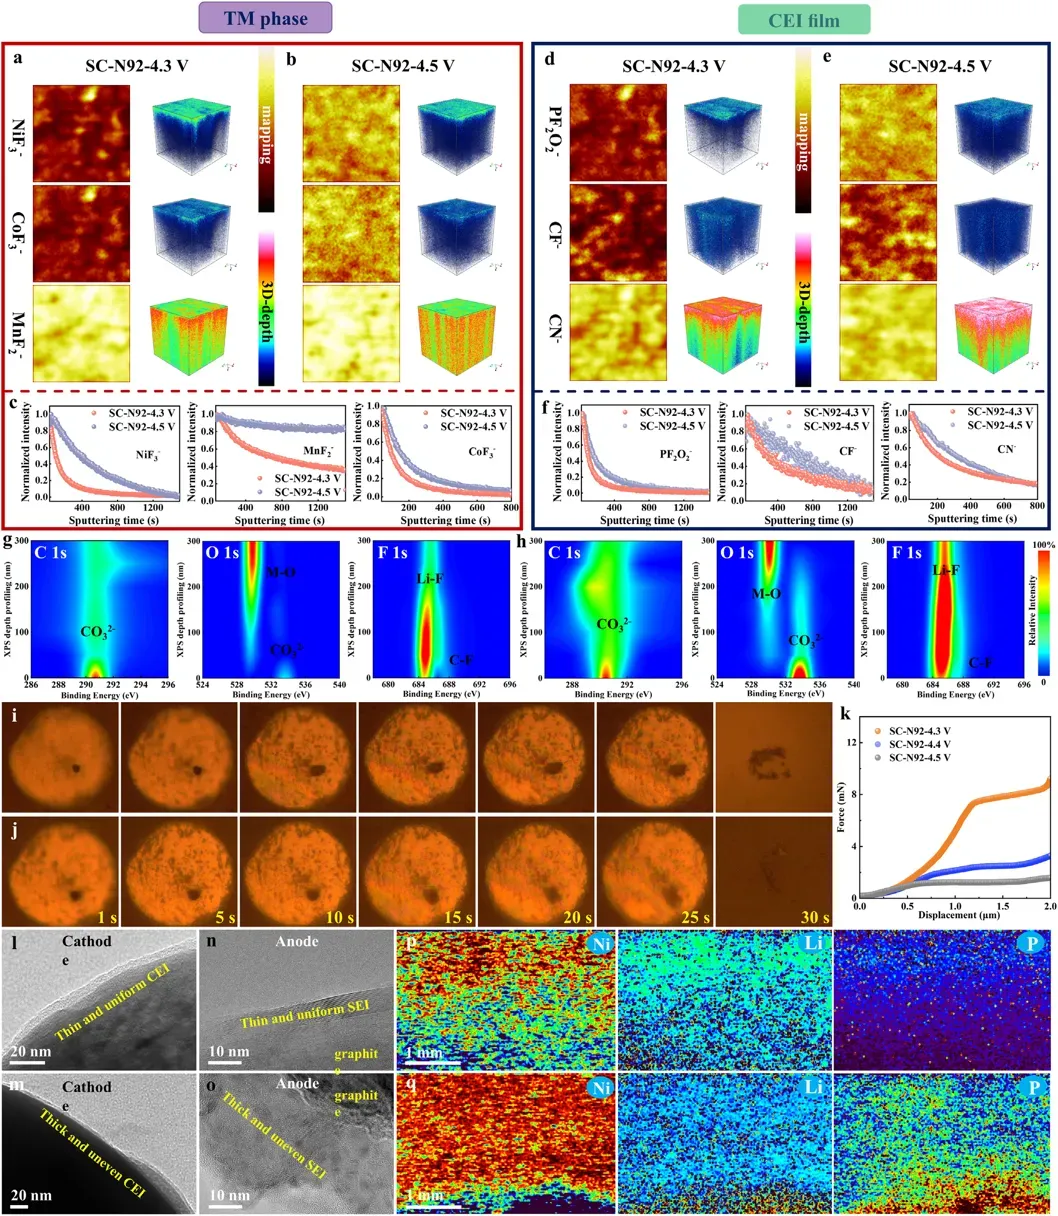
Figure 6. Characterization of the morphology in pouch-type full cells at 45°C after 300 cycles.
The degradation initiated by lattice bending and phase transition does not remain confined to the cathode. TOF-SIMS depth profiling combined with XPS etching (Figure 6) provided a layer-by-layer chemical analysis from the SC-N92 particle surface into the bulk interior. Three key findings emerged:
LA-ICP-MS and cross-sectional TEM (Figure 6) traced the downstream consequences of this cathode degradation. Quantitative LA-ICP-MS analysis of the cycled graphite anode revealed significant Ni deposition — the dissolved transition metals migrate through the separator and electrochemically deposit on the anode surface. The corresponding anode TEM images showed a thick, irregular SEI on the 4.5V-paired anode, with Ni-rich inclusions that act as catalytic sites for further electrolyte decomposition. This creates the chain interfacial failure from cathode to anode in Li-ion batteries: cathode cracking → electrolyte penetration → TM dissolution → Ni deposition on anode → catalytic SEI growth → active lithium trapped in anode SEI → accelerated full-cell capacity fade. The bidirectional consumption of active lithium — at both the cathode CEI and the anode SEI — explains why the full-cell capacity fade rate at 4.5V is substantially faster than what half-cell data alone would predict.
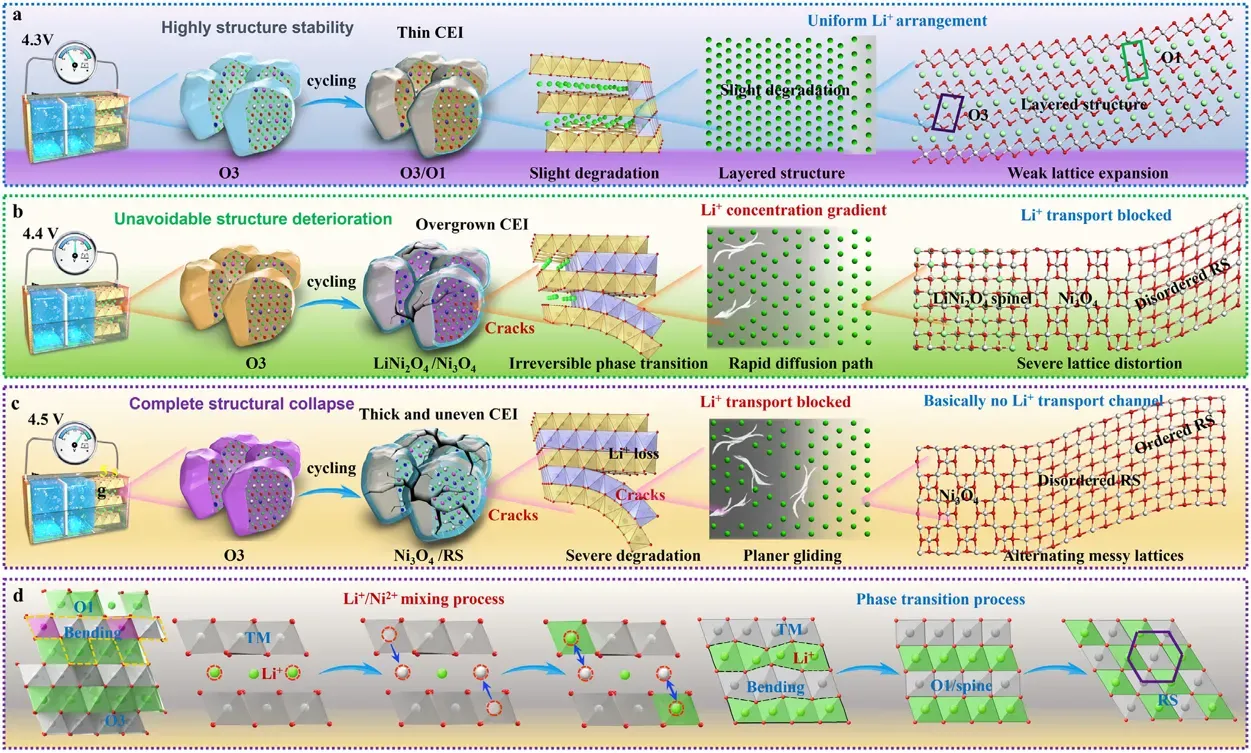
Figure 7. Comprehensive degradation mechanism schematic during long-term cycling.
Voltage window optimization for single-crystal NCM cathodes is not merely a matter of trading capacity for cycle life — it represents a fundamental binary choice between two degradation regimes:
Figure 7 provides the complete mechanistic schematic — the full-chain chemo-mechanical failure loop — synthesizing all characterization data into a single degradation model that connects lattice-scale phenomena (bending, phase transition) to particle-scale outcomes (cracking, strength loss) to cell-scale failure (CEI/SEI growth, TM crossover, capacity fade). This model fills the theoretical gap in understanding high-voltage cycling failure mechanism of single-crystal Ni-rich cathodes and provides atomic-scale guidance for practical engineering strategies including voltage window control, lattice-strain buffer doping, and conformal surface coating.
| Parameter | 4.3V Cut-off | 4.5V Cut-off | Interpretation |
|---|---|---|---|
| c-axis Contraction | 3.91% | 4.82% | Higher voltage produces greater anisotropic lattice contraction |
| H2-H3 response during the measured cycle | Reversible | Irreversible | The in situ XRD data indicate high reversibility during the measured cycle; long-term degradation is more severe at 4.5 V |
| Local phase reconstruction | Relatively limited, with local disorder and O3→O1/O1–LiNi₂O₄ regions | More extensive spinel-, Ni₃O₄-, and rock-salt-like reconstruction | Reconstruction becomes more severe as the cutoff voltage increases |
| Single-Particle Strength (SPFT2000) |
Longer time to fracture and less visible damage | Earlier fracture and more severe damage | Particles retain better mechanical integrity at 4.3 V |
| Li+ Diffusion (DLi+) | Stable | Rapidly declining | Reconstructed phases impede Li⁺ transport at 4.5 V |
These results support the use of cutoff-voltage control as one route to improving the durability of single-crystal Ni-rich cathodes. Materials strategies that reduce lattice bending, stabilize layered-to-reconstructed interfaces, or limit electrolyte access to cracked regions may provide additional benefits. Their effectiveness, however, should be evaluated under practical loading, temperature, and full-cell conditions.
This study linked phase transformation, lattice deformation, Li⁺ transport, and particle cracking in single-crystal SC-N92 cathodes cycled at elevated temperature and cutoff voltage. HAADF-STEM and GPA identified bent, strained phase boundaries containing O1, LiNi₂O₄, Ni₃O₄, and ordered or disordered rock-salt structures. The results showed that crack regions can contain different combinations of reconstructed phases. DFT, molecular dynamics, and COMSOL simulations further indicated that advanced reconstruction restricts Li⁺ transport, increases concentration gradients, and produces a more heterogeneous stress distribution.
Increasing the cutoff voltage from 4.3 to 4.5 V intensified phase reconstruction, interfacial reactions, transition-metal crossover, and particle damage. Single-particle force testing with the IEST SPFT2000 showed better mechanical integrity in particles cycled to 4.3 V than in those cycled to 4.5 V. Taken together, the findings support cutoff-voltage control and structural or interfacial stabilization as practical directions for improving the long-term durability of single-crystal Ni-rich cathodes.
Quantify single-particle fracture stress, correlate mechanical strength with phase degradation state, and screen cathode formulations or voltage protocols — all with ±0.01 mN accuracy and GB/T 43091-2023 compliance. The SPFT2000 is the same system used to generate the critical particle-strength data in this Advanced Materials study.
Also explore Solid-State Battery Testing Solutions or our application library.
This study (Liu et al., Adv. Mater. 2026, DOI: 10.1002/adma.73901) established the full O3→O1→LiNi₂O₄→Ni₃O₄→rock-salt degradation chain: O3 layered (R-3m) → O1 distorted (P-3m1) → LiNi₂O₄ spinel (Fd-3m) → Ni₃O₄ (Cmmm, ★newly identified) → rock-salt (Fm-3m). Each step progressively degrades Li⁺ transport, with Ni₃O₄ representing the critical bottleneck. This high-voltage cycling failure mechanism of ultra-high-Ni single-crystal cathodes is driven by lattice bending-induced stress concentration.
Lattice bending induced stress concentration — directly visualized by HAADF-STEM + GPA strain mapping — creates localized high-strain regions where the oxygen framework distorts, facilitating transition-metal migration from octahedral to tetrahedral sites. This initiates the phase transition cascade. The resulting phase boundaries create stiffness mismatches that amplify local stress, forming a positive-feedback stress-chemical coupling loop. Single-particle fracture stress, measured by the IEST SPFT2000, quantitatively confirms that particles with more severe lattice bending exhibit proportionally lower mechanical strength.
Ni₃O₄ (Cmmm) is the key intermediate phase bridging spinel-to-rock-salt transformation — previously unrecognized. DFT calculations show it possesses a Li⁺ migration barrier ~3× higher than the O3 phase, effectively blocking ion transport. Ni₃O₄ forms only in high-voltage (≥4.5V) crack regions and coexists with LiNi₂O₄ and rock-salt — the multi-phase coexistence at crack regions overturns the prior assumption that only rock-salt forms at cracks.
C-axis lattice contraction and anisotropic strain in Ni-rich cathodes is the dominant mechanical strain mode. In-situ XRD shows 3.91% contraction at 4.3V (reversible H2-H3) vs 6.41% at 4.6V (irreversible). The irreversible H2-H3 phase transition in high-voltage NCM at 4.6V means the lattice cannot recover its original dimensions upon relithiation — permanent disordering accumulates, nucleating the O3→O1 transformation and triggering the full degradation cascade.
Voltage window optimization for single-crystal NCM cathodes: 4.3V is identified as the optimal upper cut-off. At 4.3V, c-axis contraction is limited to 3.91%, the H2-H3 transition remains reversible, phase degradation is confined to the O3→O1 stage, and electrochemical performance (cycling stability, rate capability, impedance growth) outperforms 4.4V and 4.5V across all metrics. The IEST SPFT2000 confirms that 4.3V-cycled particles retain substantially higher mechanical strength.
Chain interfacial failure from cathode to anode in Li-ion batteries proceeds through: (1) cathode cracking → electrolyte penetrates → thick, non-uniform CEI forms; (2) transition metals (Ni, Mn, Co) dissolve from the degraded cathode; (3) dissolved TM ions migrate through the separator; (4) TM deposition on the graphite anode catalyzes electrolyte decomposition → thick, degraded SEI; (5) bidirectional active-lithium consumption accelerates full-cell capacity fade. LA-ICP-MS and TEM confirmed this pathway.
DFT and MD simulation for cathode phase transition kinetics provided the quantitative atomic-scale explanation: DOS calculations show progressively reduced electronic conductivity along the O3→O1→LiNi₂O₄→Ni₃O₄→RS chain; charge density difference analysis reveals weakened TM-O bonding; Li⁺ migration barrier calculations identify Ni₃O₄ as the kinetic bottleneck (3× higher barrier than O3); and COHP bond analysis confirms that high-voltage phase boundaries exhibit excessively strong interfacial bonding that further impedes Li⁺ transport.
