

📄 Source Paper
Chengkun Zhang, Hongfei Zheng, Liang Lin, Jiansen Wen, Shiyu Zhang, Xinchao Hu, Dongwei Zhou, Baisheng Sa, Laisen Wang, Jie Lin, Qingshui Xie, Dong-Liang Peng, Jun Lu
DOI: 10.1038/s41560-026-02090-x
| Journal: Nature Energy (2026)
| Institutions: Ningbo Eastern University of Technology (Academician Sun Xueliang / Prof. Wang Changhong), Xi’an Jiaotong University, Zhejiang University
Research on solid electrolytes has focused primarily on increasing ionic conductivity, with reported values for widely studied inorganic electrolytes ranging from approximately 10⁻⁴ to 10⁻² S cm⁻¹. Their electronic conductivity is much lower, typically around 10⁻⁹ to 10⁻⁸ S cm⁻¹, but it is not necessarily negligible in thin-electrolyte cells. Electronic leakage through the solid electrolyte can allow electrons to move internally from the lithiated anode toward the cathode. This process consumes stored charge while the cell is at open circuit and is referred to as physical self-discharge. Unlike chemical self-discharge caused by irreversible parasitic reactions, much of the capacity lost through physical self-discharge may be recovered during subsequent charging.
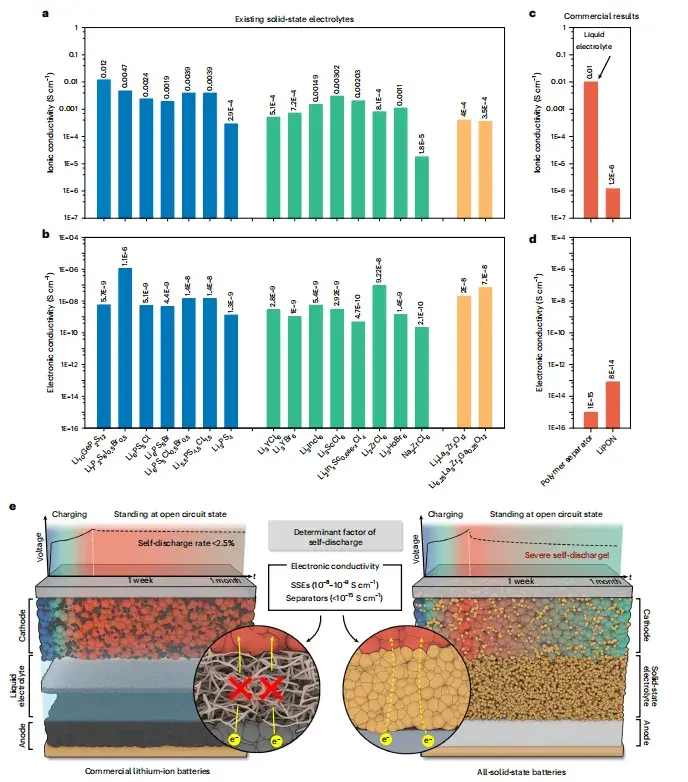
Figure 1. Comparative analysis of ionic and electronic conductivities of sulfide, oxide, and halide solid electrolytes, commercial polymer separators, and LiPON thin-film electrolytes.
| Electrolyte Type | Ionic Conductivity (S/cm) | Electronic Conductivity (S/cm) | Commercialization Status |
|---|---|---|---|
| Sulfide (e.g., Li6PS5Cl) | 10-3 – 10-2 | 10-8 – 10-9 | R&D stage |
| Oxide (e.g., LLZO) | 10-4 – 10-3 | 10-8 – 10-9 | R&D stage |
| Halide (e.g., Li3InCl6, Li3YBr6) | 10-3 – 10-2 | 10-8 – 10-9 | R&D stage |
| LiPON thin film | 10-6 | ~10-14 | Commercial (thin-film) |
| Polymer separator | N/A (liquid electrolyte carrier) |
10-15 – 10-18 | Commercial (liquid Li-ion) |
The consequence of this electronic leakage is illustrated schematically in Figure 1: electrons spontaneously migrate from the (lithiated) anode through the solid electrolyte to the cathode, forming an internal short-circuit-like loop that continuously drains stored energy even when the battery is idle. This is the mechanism of physical self-discharge — fundamentally distinct from the chemical self-discharge caused by interfacial side reactions.
Laboratory-scale ASSBs typically use pelletized solid electrolytes approximately 1000 μm thick. Practical cells require much thinner electrolyte layers to reduce inactive mass and volume. Therefore, this study compared a 1000 μm electrolyte configuration with a 20 μm configuration to quantify how thickness and electronic conductivity affect physical self-discharge.
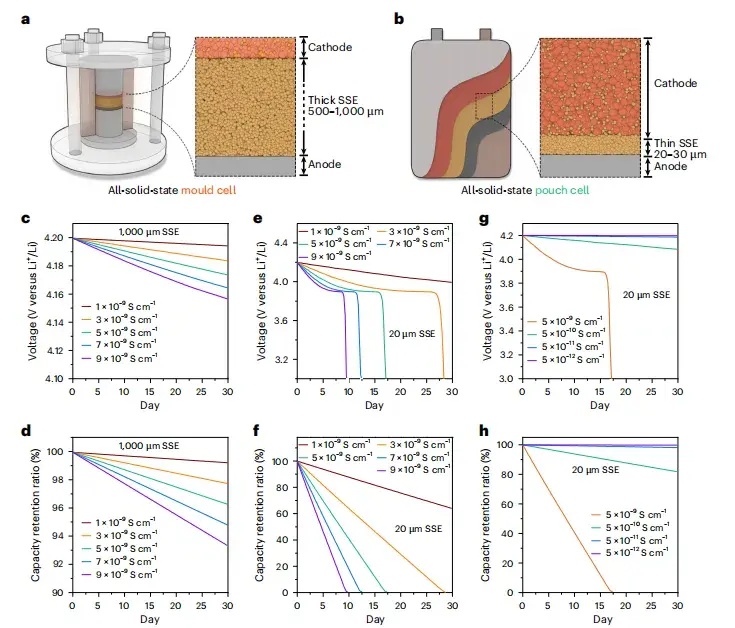
Figure 2. Simulation of the physical self-discharge behavior of ASSBs as a function of solid-electrolyte electronic conductivity and thickness for 1000 and 20 μm electrolyte configurations.
| Configuration | Electronic Conductivity, σₑ (S cm⁻¹) | 1-Month Capacity Retention | Key Finding |
|---|---|---|---|
| 1000 μm thick | 9 × 10⁻⁹ | 93.3% | Self-discharge relatively limited at laboratory thickness |
| 1 × 10⁻⁹ | 99.2% | Reducing σe improves retention even at thick scale | |
| 20 μm thin film | > 3 × 10⁻⁹ | approx. 0% | Complete voltage collapse within 1 month |
| < 5 × 10-11 | >95% | Threshold to achieve acceptable self-discharge — unprecedented in current materials |
For a fixed cell voltage, electrode area, and electronic conductivity, the electronic leakage current scales inversely with electrolyte thickness. Reducing the thickness from 1000 to 20 μm therefore increases the calculated leakage current by a factor of 50 under otherwise identical conditions. The model predicts that electronic leakage becomes increasingly important as the electrolyte approaches thicknesses relevant to practical cells.
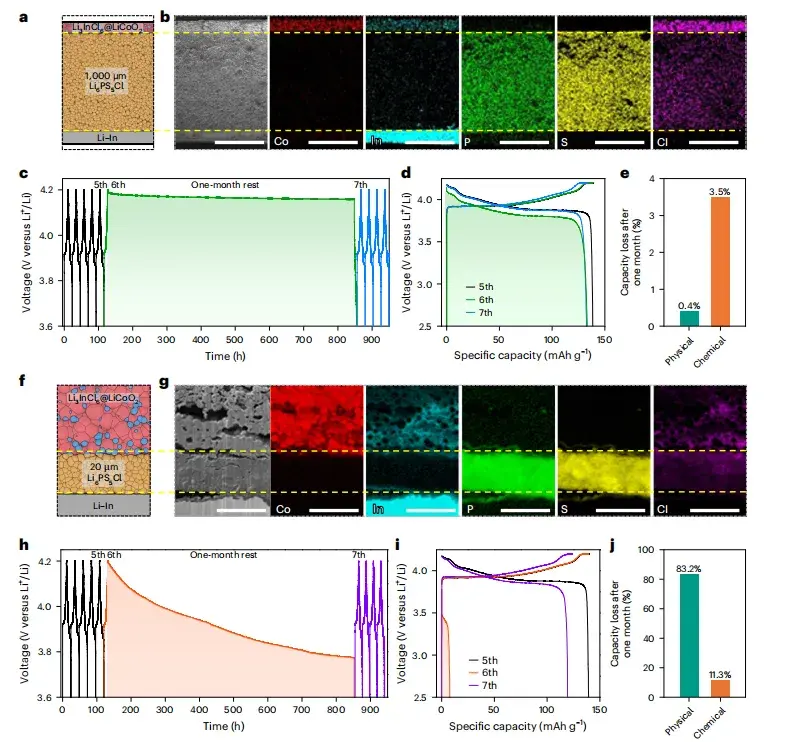
Figure 3. Self-discharge behavior of Li₃InCl₆@LiCoO₂/Li₆PS₅Cl/In-Li all-solid-state cells with electrolyte thicknesses of 1000 and 20 μm.
The researchers prepared Li₃InCl₆@LiCoO₂/Li₆PS₅Cl/In-Li all-solid-state cells using a solvent-free dry-film process and evaluated electrolyte thicknesses of 1000 μm and 20 μm. The measurements were consistent with the thickness-dependent trend predicted by the model:
The 20 μm cell also exhibited greater chemical self-discharge than the 1000 μm cell, at 11.3% versus 3.5%. This association suggests that greater electronic leakage may promote interfacial side reactions.
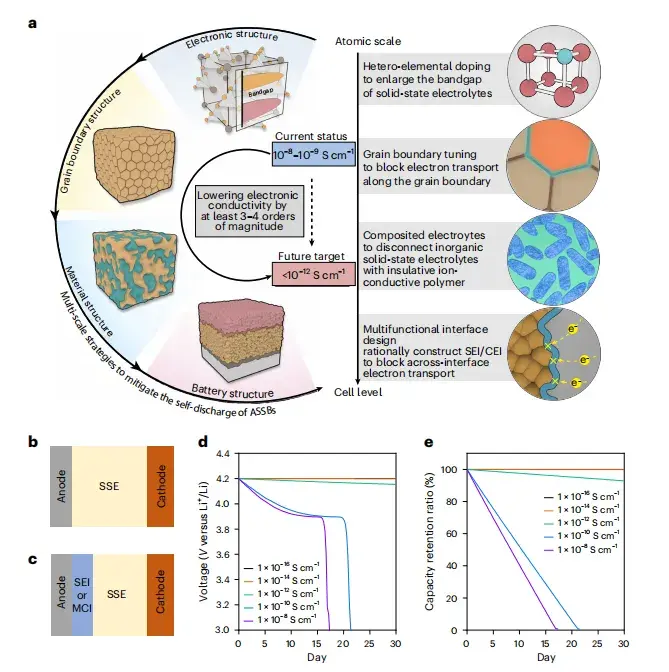
Figure 4. Atomic-, micro-, and cell-scale strategies for reducing electronic leakage and physical self-discharge.
| Scale | Strategy | Mechanism | Key Target |
|---|---|---|---|
| Atomic | Hetero-element doping | Increase the bandgap or electronic transport barrier while preserving ionic conductivity | Reduce σₑ toward 10⁻¹² S cm⁻¹ |
| Atomic | Grain boundary engineering | Block electronic transport along conductive grain-boundary pathways | |
| Micro | Inorganic/organic composite | Disrupt continuous electronic pathways while maintaining Li⁺ transport | Electronically insulating, ion-conducting composite |
| Cell | Multifunctional interface layer (artificial SEI/CEI) |
Permit ionic transport while limiting electronic leakage | Modeled 0.1 μm layer with σₑ < 10⁻¹² S cm⁻¹ and >93% one-month capacity retention |
The model also evaluated an electron-blocking interlayer between the electrode and solid electrolyte. For a 20 μm electrolyte, a 0.1 μm interlayer with an electronic conductivity below 10⁻¹² S cm⁻¹ maintained 93% capacity after one month in the simulation. This result indicates that interface design may reduce physical self-discharge even when the electronic conductivity of the bulk electrolyte cannot be lowered sufficiently.
The study shows that electronic conductivity must be measured at very low levels when evaluating solid electrolytes for thin-electrolyte ASSBs. The IEST SEMS Series Multi-Dimensional Solid Electrolyte Testing System integrates controlled pressurization, pressure monitoring, thickness measurement, pellet preparation, and electrochemical characterization. These functions allow researchers to evaluate how pressure, thickness, and material compaction affect measured ionic and electronic conductivity.
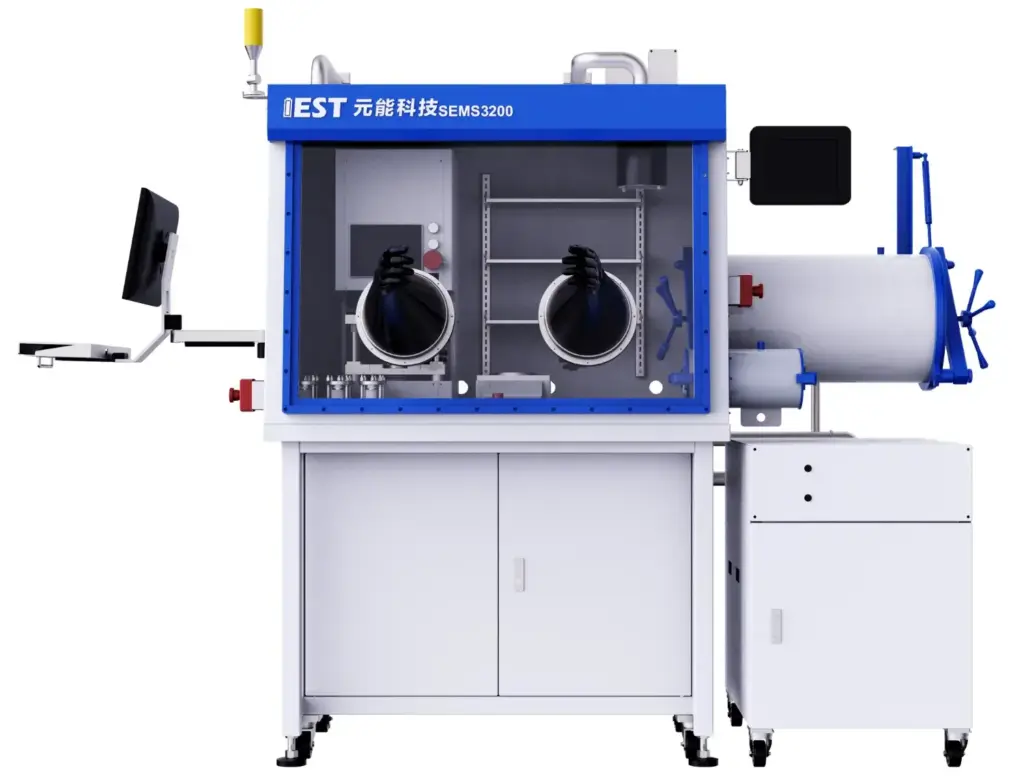
Figure 5. IEST SEMS Multi-Dimensional Solid Electrolyte Test System — integrating in-situ pressure control, real-time thickness monitoring, and electronic conductivity measurement.
The SEMS system directly addresses the three measurement challenges highlighted by this research:
This study identifies electronic conduction through inorganic solid electrolytes as an important source of physical self-discharge in ASSBs, particularly when the electrolyte is only tens of micrometres thick. In the reported cell tests, reducing electrolyte thickness from 1000 to 20 μm increased the one-month capacity loss from 3.9% to 94.5%. The recovery of much of this lost capacity during subsequent charging supports the contribution of reversible electronic leakage.
The analysis indicates that electronic conductivity should be considered alongside ionic conductivity, electrolyte thickness, and interfacial design when evaluating solid electrolytes. Reducing bulk electronic conductivity remains the primary materials objective, while grain-boundary control, composite electrolytes, and electron-blocking interlayers may provide complementary routes to limiting physical self-discharge.
Quantify electronic conductivity across 10⁻⁶–10⁻¹² S/cm, correlate pressure-thickness-conductivity in situ, and screen electrolytes against the 10⁻¹² S/cm self-discharge threshold. The IEST SEMS series provides the precision measurement foundation this Nature Energy study calls for.
Physical self-discharge is the spontaneous loss of stored charge caused by electronic leakage through the solid electrolyte — electrons migrate from the anode through the electrolyte to the cathode, forming an internal loop that drains energy. It is distinct from chemical self-discharge (irreversible interfacial side reactions) and is largely recoverable upon recharging. This Nature Energy study (DOI: 10.1038/s41560-026-02090-x) first quantified its severity: 83.2% of the 94.5% capacity loss in thin-film ASSBs was physically recoverable.
The electrolyte thickness effect on all-solid-state battery self-discharge is governed by an inverse relationship: leakage current scales inversely with thickness. Thinning from 1000 μm to 20 μm (50×) increases leakage current 50× for the same electronic conductivity. Experimentally, this raises 1-month capacity loss from 3.9% (1000 μm) to 94.5% (20 μm). Practical high-energy-density cells require thin electrolytes, making this the central challenge for ASSB commercialization.
The electronic conductivity of sulfide oxide halide solid electrolytes comparison reveals a troubling uniformity: all three families show electronic conductivity in the 10⁻⁸–10⁻⁹ S/cm range, regardless of their ionic conductivity differences (10⁻⁴–10⁻² S/cm). This is 6–7 orders of magnitude higher than commercial polymer separators (10⁻¹⁵–10⁻¹⁸ S/cm) and LiPON thin-film electrolyte (~10⁻¹⁴ S/cm). No current inorganic solid electrolyte approaches the 10⁻¹² S/cm threshold required for commercial-grade self-discharge rates.
Interface engineering to block electronic leakage in solid electrolytes inserts a thin ion-conductive but electron-blocking layer (artificial SEI/CEI) between the electrolyte and electrode. Simulation verified that a 0.1 μm interface layer with σe <10⁻¹² S/cm sustains >93% capacity retention even in 20 μm systems. This is the most practical mitigation because it decouples self-discharge control from the fundamental limits of bulk electrolyte materials.
Solid electrolyte electronic conductivity measurement by DC polarization applies a constant DC voltage across a blocking-electrode cell (e.g., Au/electrolyte/Au) and measures the steady-state leakage current after ionic current decays to zero. σe = I·L/(V·A), where I is steady-state current, L is thickness, V is voltage, A is area. The IEST SEMS system supports both electrochemical-workstation DC polarization and high-precision DC instrumentation, covering 10⁻⁶–10⁻¹² S/cm — the range needed to track progress toward the 10⁻¹² S/cm target.
To match commercial Li-ion batteries (monthly self-discharge <2.5%), solid electrolyte electronic conductivity must reach approximately 10⁻¹² S/cm — a 3–4 order-of-magnitude reduction from the current 10⁻⁸–10⁻⁹ S/cm. For a more lenient target of <5% monthly self-discharge, σe must fall below 5×10⁻¹¹ S/cm. No current inorganic solid electrolyte meets either threshold, highlighting the urgency of the mitigation strategies outlined in this study.
