

In the lithium-ion battery supply chain, anode material selection directly determines a cell’s energy density, cycle life, fast-charging performance, and manufacturing cost. Natural graphite and artificial graphite, as the two mainstream anode materials, remain a key point of R&D and supply-chain competition for both cell manufacturers and material suppliers. This article compares the two material types across four dimensions: single-particle crushing strength and morphology, powder compaction density, rebound and deformation under pressure, and resistivity, using IEST Instrument SPFT2000 and PRCD3100 system.
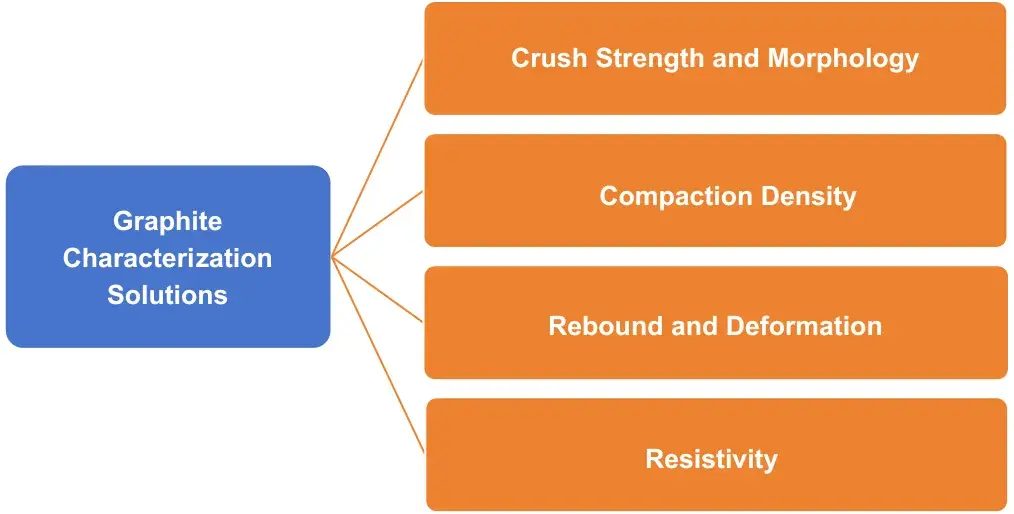
Figure 1. Graphite characterization approach across four dimensions — single-particle crushing strength and morphology, powder compaction density, rebound and deformation, and resistivity.
Two test systems were used throughout this study. The IEST SPFT2000 single-particle mechanical property test system (Figure 2a) measures the crushing force and crushing strength of individual graphite particles. The IEST PRCD3100 powder resistivity and compaction density tester (Figure 2b) measures resistivity, compaction density, and rebound/deformation behavior of graphite powder under a range of applied pressures.
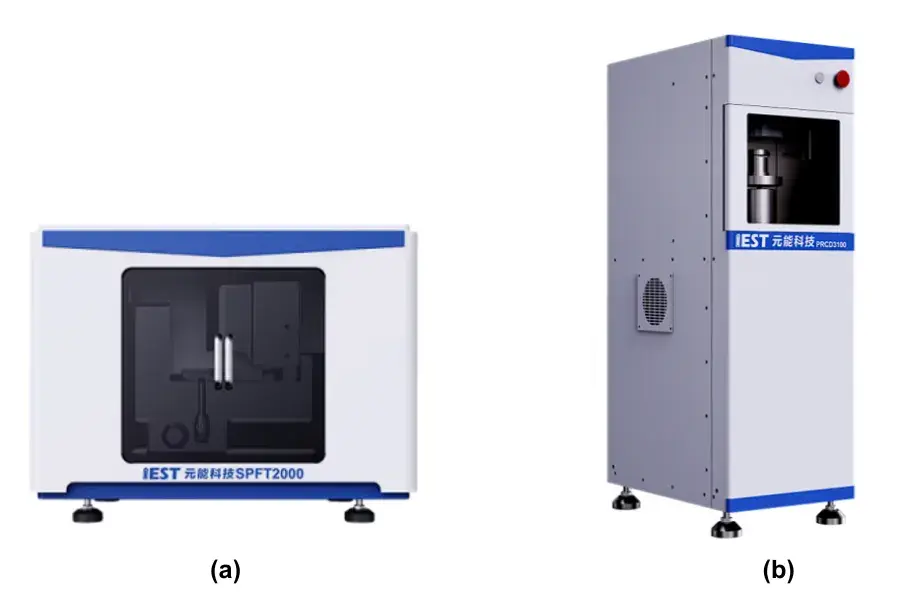
Figure 2. (a) The IEST SPFT2000 single-particle mechanical property test system, used to measure crushing force and crushing strength of individual graphite particles; (b) the IEST PRCD3100 powder resistivity and compaction density tester, used to measure resistivity, compaction density, and rebound/deformation behavior of graphite powder under pressure.
Four graphite materials with similar particle size (D50 11–12 μm) — artificial graphite AGr-1 and AGr-2, and natural graphite NGr-1 and NGr-2 — were dispersed evenly and dropped individually onto glass slides to measure crushing force and crushing strength. The powder crushing strength was calculated from the crushing force using the formula shown below.
The compressive strength of the powder is calculated according to Equation (1):
\[p_{cs} = \alpha \times 1000 \times \frac{F_{yk}}{\pi \cdot d^2}\]
where:
\(p_{cs}\) — compressive strength, in MPa;
\(\alpha\) — calculation coefficient, taken as 2.48;
\(F_{yk}\) — crushing force, in mN;
\(d\) — particle size (diameter), in \(\mu\)m.
The four graphite materials were also tested under pressurization, depressurization, and steady-state modes, as shown in Figure 3.
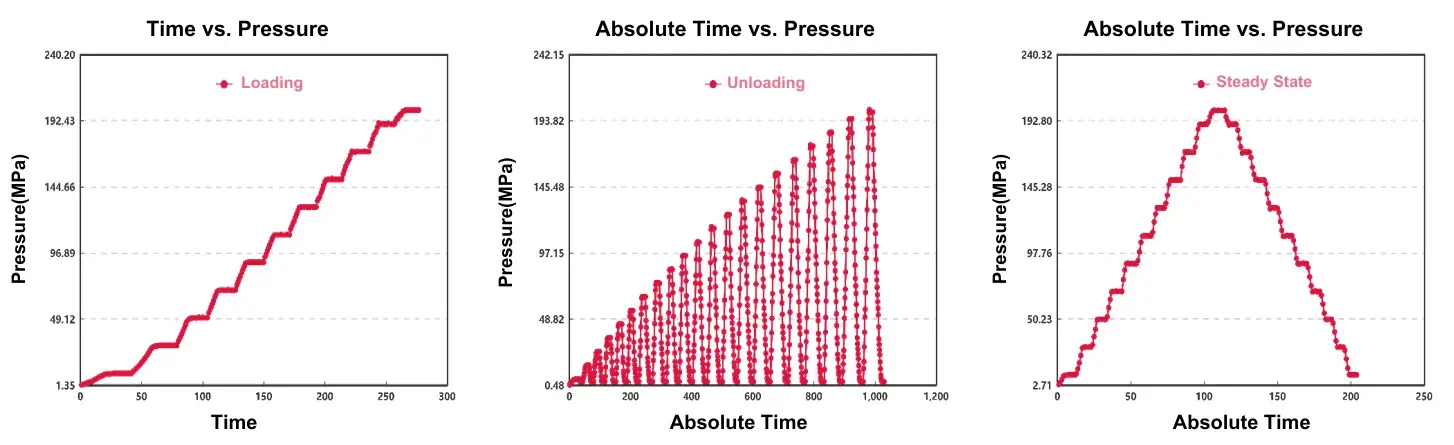
Figure 3. Test mode curves used in powder compaction testing: (a) Loading mode (pressure vs. time); (b) unloading mode (repeated load/unload cycles); (c) steady-state mode.
Single-particle crushing strength characterizes a graphite particle’s ability to resist fracture under external force, and is related to the stability of the anode’s microstructure over cycling. As shown in Figure 4(b) and (c), the crushing force curves of artificial graphite and natural graphite differ, and artificial graphite’s crushing strength is markedly higher than that of natural graphite. Artificial graphite is typically produced from needle coke or pitch coke precursors, graphitized above 2800°C to form a polycrystalline, cross-linked structure in which grain boundaries impede crack propagation and improve resistance to fracture. Natural graphite, by contrast, relies on van der Waals forces to hold its layered sheet structure together; the weaker interlayer bonding makes it prone to cleavage and sheet delamination under pressure, so its particles fracture more readily. Because graphite particles are subject to continuous alternating stress during lithium intercalation/deintercalation cycling, particle fracture can trigger repeated rupture and reconstruction of the SEI layer, consuming active lithium and electrolyte and causing a sudden drop in cycling performance.
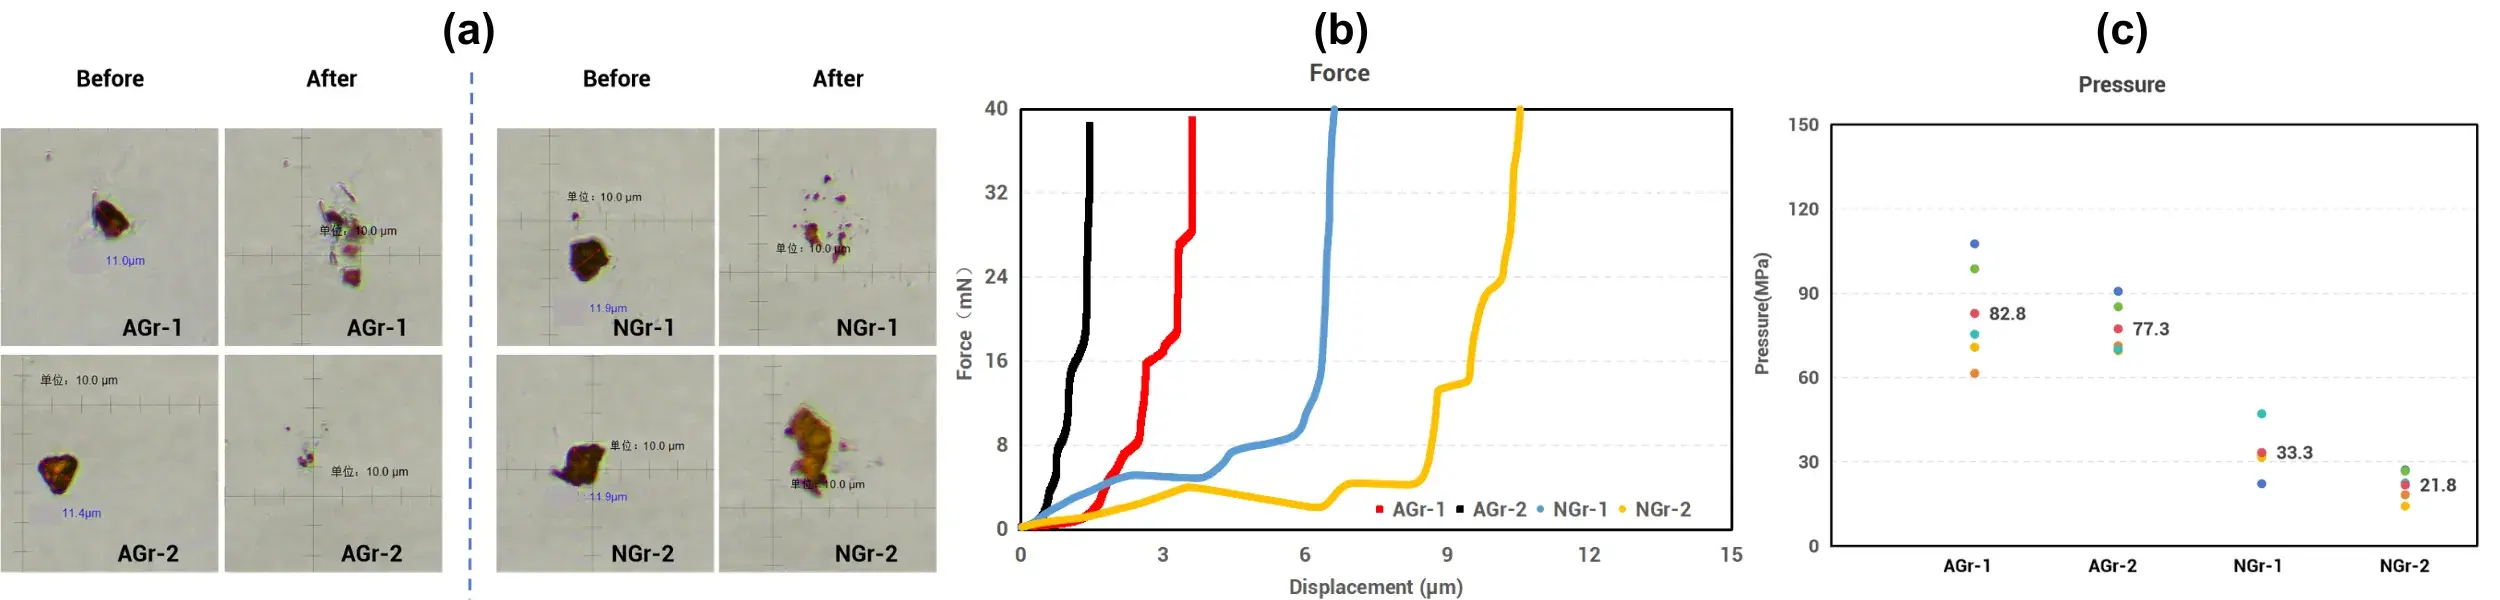
Figure 4. Single-particle mechanical test results for four graphite samples (AGr-1, AGr-2 artificial graphite; NGr-1, NGr-2 natural graphite, D50 11–12 μm)
Powder resistivity reflects the electrical contact capability between particles, and directly affects a cell’s DC internal resistance, fast-charging heat generation, and low-temperature discharge capability. Test results under a 10–350 MPa pressurization mode show that artificial graphite resistivity is far lower than that of natural graphite: at 10 MPa, AGr-1 resistivity is $7.0 \times 10^{-5}$ Ω·cm, while NGr-1 reaches as high as 0.014 Ω·cm — a difference of roughly three orders of magnitude. From a crystal-structure perspective, graphite conducts electricity well within the basal plane but has very high interlayer resistance. Natural graphite particles have strong orientation, so under pressure their sheets tend to stack in an aligned manner, which increases inter-particle contact resistance. Artificial graphite has an isotropic, polycrystalline structure, giving it a more continuous electron transport pathway and therefore lower powder resistivity.
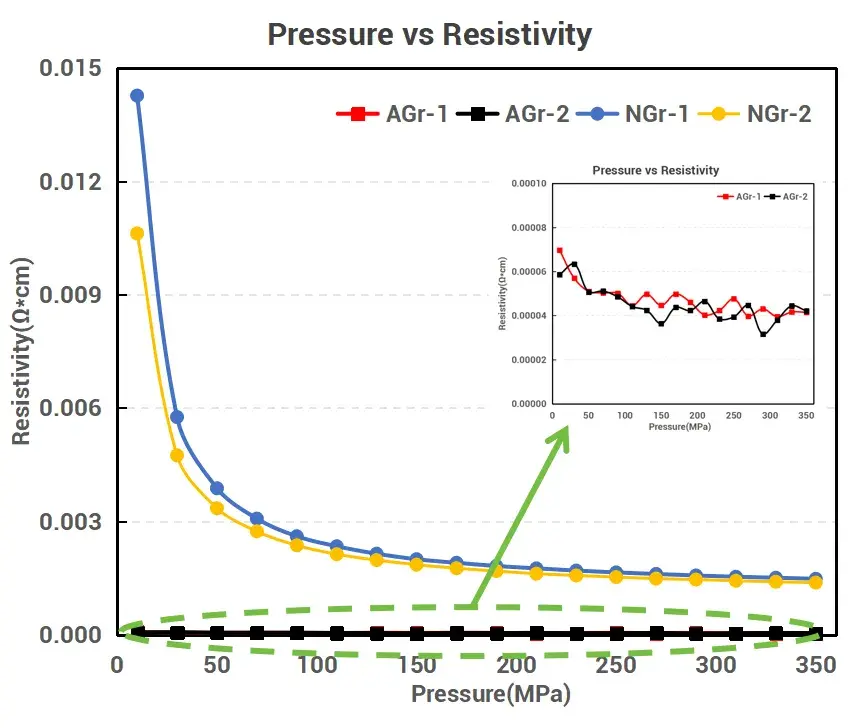
Figure 5. Resistivity versus pressure comparison for four natural and artificial graphite powder samples from 10 to 350 MPa.
Compaction density determines how much active material is packed per unit volume, and is a key indicator of a cell’s volumetric energy density. As shown in Figure 6(a), at the same applied pressure, natural graphite reaches a higher compaction density than artificial graphite: after unloading from 369 MPa, natural graphite NGr-2 reaches 1.850 g/cm³, while artificial graphite AGr-1 reaches only 1.663 g/cm³. After pressurization and depressurization, artificial graphite samples show a greater thickness change (rebound) than natural graphite. This behavior relates to single-particle elastic-plastic behavior: natural graphite particles have a higher plastic fraction, so their elastic recovery after unloading is smaller, while artificial graphite has a higher elastic fraction and rebounds more after unloading. Research indicates that natural graphite sheets slip and rearrange more readily, allowing tighter particle packing under high pressure, while artificial graphite particles have higher rigidity and more limited plastic deformation, giving them a lower compaction ceiling. Natural graphite also carries a distinct threshold risk: as shown in Figure 6(b), once pressure exceeds a critical value, particles begin to fracture, degrading the electrode’s pore structure and affecting electrolyte wetting and ion conduction.
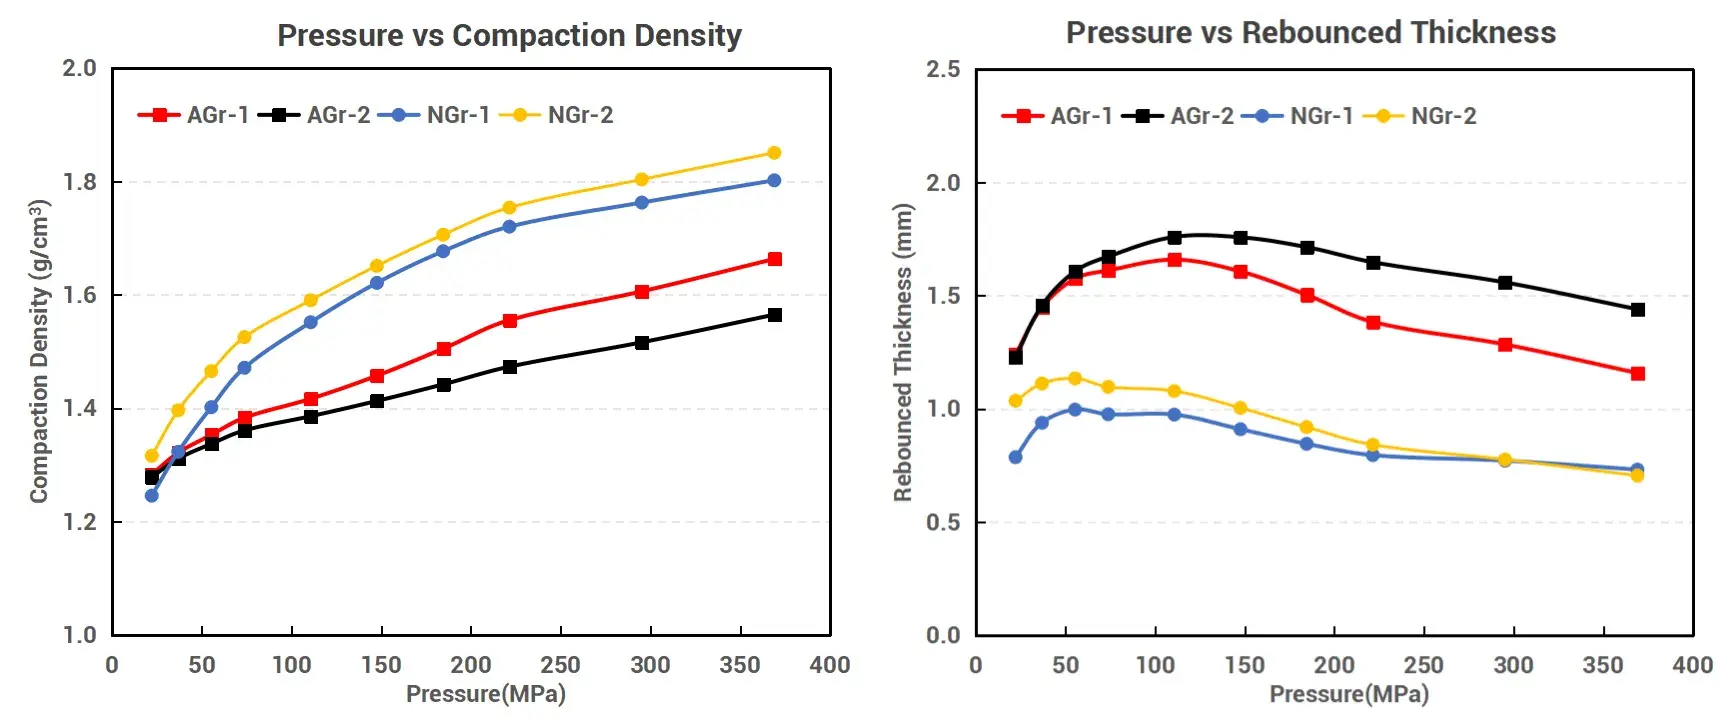
Figure 6. Compaction density and rebounded thickness versus pressure comparison for natural and artificial graphite powder.
The total deformation and elastic deformation a powder exhibits under pressure affect post-rolling electrode thickness consistency and assembly clearance margin, making this a key parameter for mass-production yield. As shown in Figure 7, natural graphite reaches a higher maximum deformation (NGr-1 reaching 45.16%), while artificial graphite shows lower total deformation (AGr-1 reaching a maximum deformation of 35.61%).
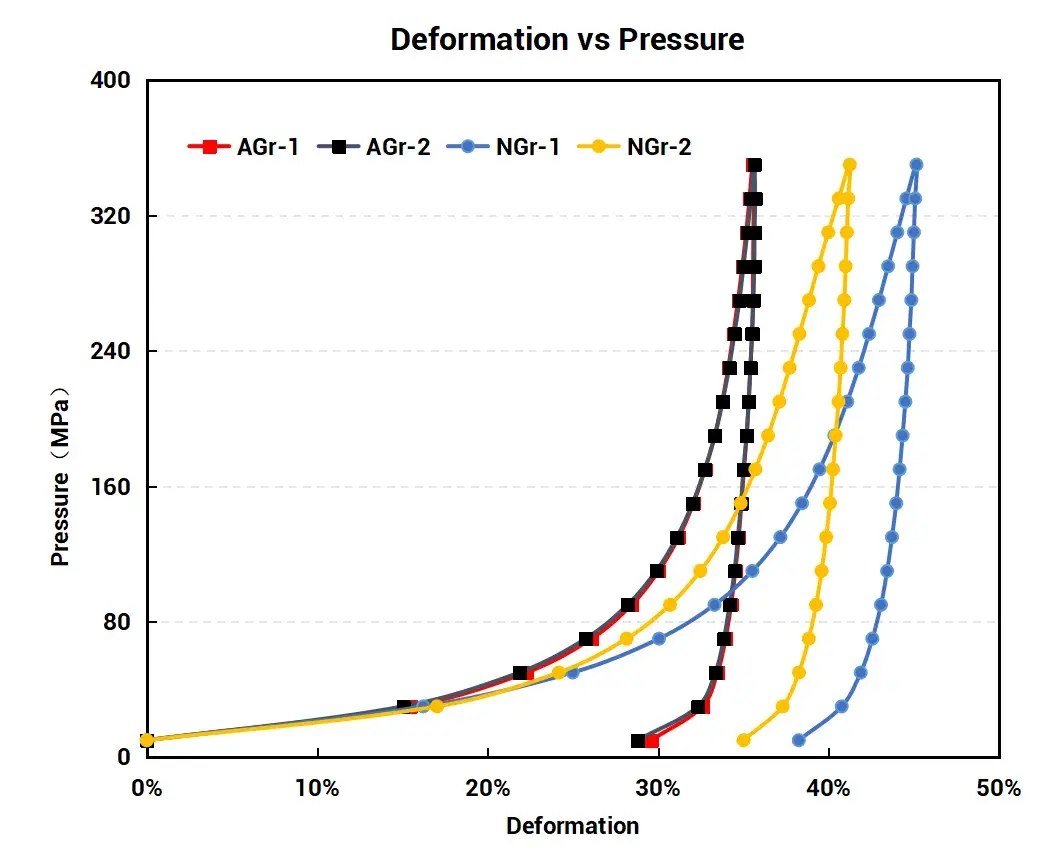
Figure 7. Deformation versus pressure comparison showing maximum deformation for natural and artificial graphite powder samples.
The performance differences between natural graphite and artificial graphite are, in essence, a combined trade-off among energy density, cycle life, cost, and process window. For applications prioritizing extreme volumetric energy density, cost sensitivity, and moderate cycling requirements, modified spherical natural graphite holds an advantage. For applications prioritizing long cycle life, high rate capability, and wide-temperature-range reliability, artificial graphite is the more robust choice. Blending artificial and natural graphite, together with surface coating modification, allows each material’s strengths to offset the other’s limitations, and represents a core approach for finding the right balance among energy density, cycle life, and cost in anode material development and cell material selection.
The IEST SPFT2000 single-particle mechanical property tester and IEST PRCD3100 powder resistivity and compaction density tester referenced in this article support the crushing strength, compaction density, rebound/deformation, and resistivity testing needed to compare and select anode materials.
In the data presented here, artificial graphite showed higher single-particle crushing strength and lower powder resistivity than natural graphite, while natural graphite showed higher compaction density at the same pressure and lower rebound after unloading. Natural graphite also showed higher maximum deformation and a distinct particle-fracture threshold under high pressure.
Selecting natural or artificial graphite depends on which performance dimension matters most for the application. Natural graphite favors higher volumetric energy density and lower cost at moderate cycling requirements, provided pressure stays below its particle-fracture threshold. Artificial graphite favors long cycle life, high rate capability, and wide-temperature-range reliability, at a higher crushing strength and lower resistivity.
Compaction density measures how much active material is packed into a given electrode volume under pressure; higher compaction density supports higher volumetric energy density. In this study, natural graphite reached a higher compaction density (up to 1.850 g/cm³) than artificial graphite (up to 1.663 g/cm³) at the same pressure, but natural graphite also carries a particle-fracture risk beyond a critical pressure threshold.
Single-particle crushing strength is the mechanical strength of an individual graphite particle against fracture under compressive force, calculated per GB/T 43091-2023 from the measured crushing force and particle diameter. In this study, artificial graphite reached 77.3–82.8 MPa, while natural graphite reached only 21.8–33.3 MPa.
