

When power batteries in new energy vehicles experience mechanical abuse such as puncture or crushing, the internal separator can readily rupture, allowing the cathode and anode electrodes to make direct contact and form a short circuit. This can rapidly escalate into thermal runaway, leading to fire or explosion. Conventional surface-temperature monitoring suffers from thermal-conduction lag: by the time a temperature anomaly is detected, the cell has often already entered an irreversible failure stage, which does not meet the timeliness requirements for early warning.
Electrochemical impedance spectroscopy (EIS), as a non-destructive characterization technique, can resolve charge transfer, ion diffusion, and interfacial evolution processes inside a battery across multiple timescales from the frequency domain, and is highly sensitive to the interfacial structural changes caused by a micro-short circuit. This study combines a full-area, nine-point temperature measurement with high-sensitivity, real-time EIS monitoring to systematically test the nail-penetration failure characteristics of a gel electrolyte solid-state battery, aiming to reveal how impedance parameters evolve during penetration and to provide a new technical path for early warning of battery thermal runaway.

Gel electrolyte solid-state battery with a cell thickness of 10 mm and an NMC532 ternary chemistry.
Surface temperature was monitored using a uniform nine-point layout, with K-type thermocouples arranged in a 3×3 array across the cell surface to cover both the central region and the edges. Temperature data collection began synchronously with the start of each test.
Impedance was measured using the IEST BIT7000 impedance tester, which supports rapid EIS measurement across a test frequency range of 20 kHz to 10 mHz. This study focuses specifically on tracking impedance changes at the 10 Hz characteristic frequency throughout the penetration process.
Two comparative test groups were set up. Group A used a rapid full-penetration mode, simulating a sudden mechanical damage scenario. Group B used a stepwise penetration mode: the needle advanced 1 mm at a time with a 10-minute rest after each step, to a total penetration depth of 3 mm, followed by a 4-minute rest after reaching 3 mm, simulating a progressive damage evolution process. In both groups, the nine-point temperature sensing lines and the BIT7000 test fixture were set up and EIS testing was started in advance; the penetration device was started, and temperature recording began synchronously, only after personnel had left the test area.
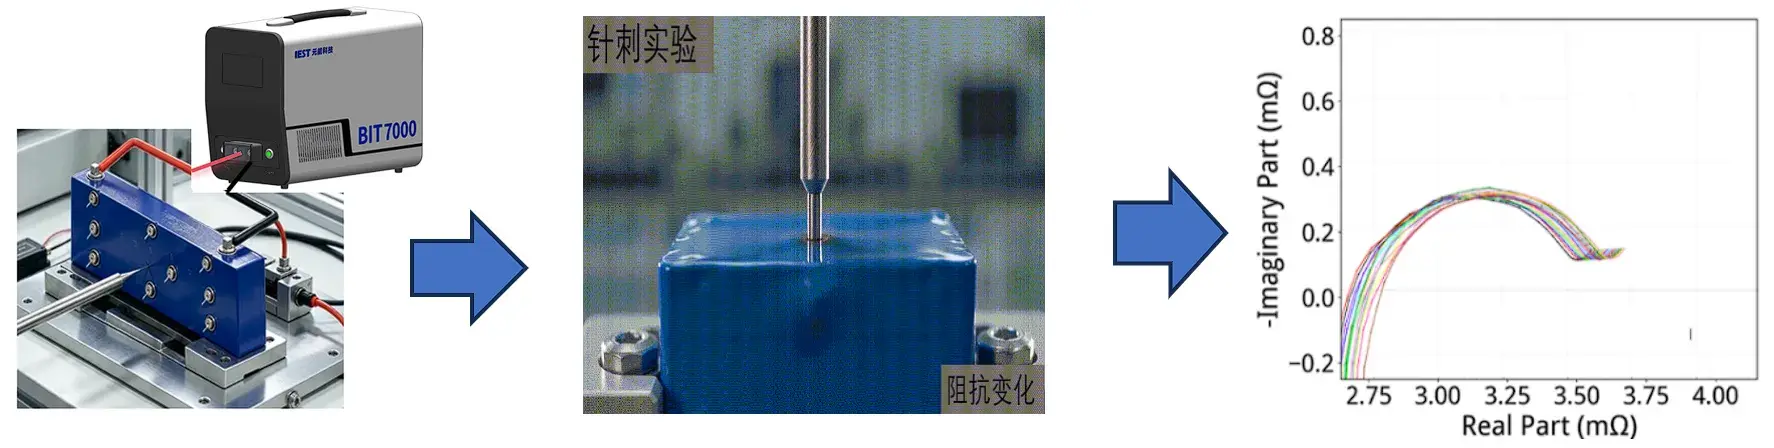
Figure 1. IEST BIT7000 battery impedance tester monitoring real-time dynamic EIS Nyquist plot evolution during a prismatic cell nail penetration test.
EIS data at the 10 Hz characteristic frequency extracted throughout the nail penetration process was comparatively analyzed against the synchronously recorded temperature curves. The results demonstrate that the EIS response to internal short circuits significantly precedes that of surface temperature, with a lead time ranging from tens of seconds to several minutes, validating the feasibility of EIS for early failure warning.
After rapid penetration, an internal short circuit formed inside the cell, and continuous Joule heating caused a gradual rise in temperature. On the impedance side, the 10 Hz imaginary part showed a sudden, sharp drop at the instant of penetration, followed by a brief rebound and then a slow decline. The sharp drop in the 10 Hz imaginary part originates from the steel needle creating direct contact between the positive and negative electrodes, which sharply reduces the equivalent parallel resistance. The brief rebound is associated with gas generation from electrolyte decomposition driven by localized Joule heating at the short-circuit point, which momentarily increases contact resistance. The subsequent slow decline corresponds to rising temperature accelerating electrode reaction kinetics, which continuously lowers charge-transfer resistance.
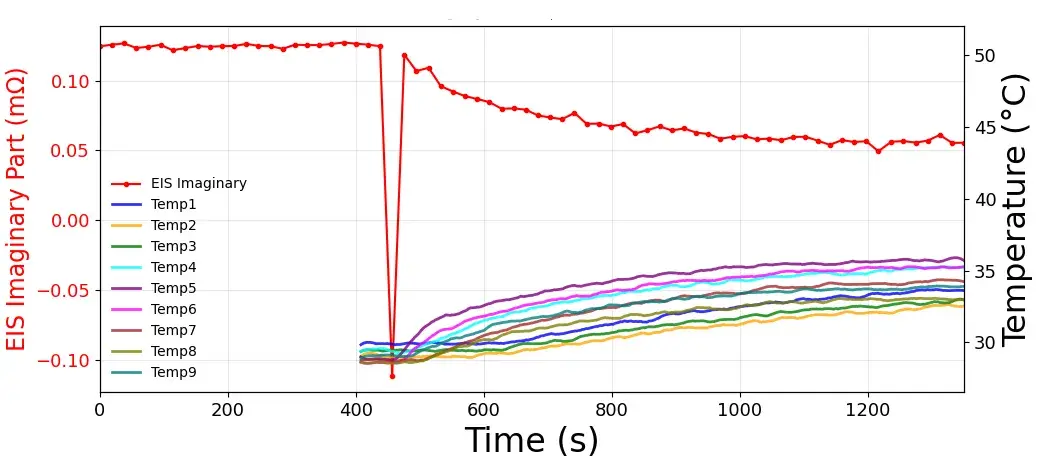
Figure 2. 10 Hz EIS imaginary part and nine-point surface temperature evolution during rapid full nail penetration of a gel electrolyte solid-state battery
Under stepwise penetration, temperature rose in a step-like pattern as penetration depth increased. The 10 Hz imaginary part showed an overall declining trend, but with pronounced fluctuations alternating between each penetration step and the following rest period. During each penetration step, mechanical damage to the separator intensifies and the micro-short-circuit area expands, causing the 10 Hz imaginary part to drop rapidly. During each rest period, localized temperature rise lowers electrolyte viscosity and raises ionic conductivity, while interfacial side-reaction products accumulate; the competition between these two effects causes the 10 Hz imaginary part to fluctuate irregularly. This irregular fluctuation pattern can serve as an important impedance signature of progressive mechanical damage.
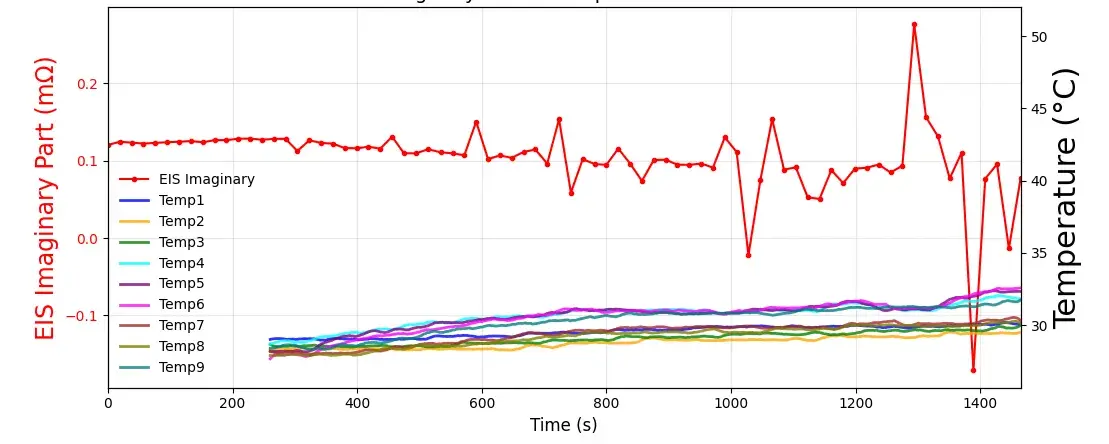
Figure 3. 10 Hz EIS imaginary part and nine-point surface temperature evolution during stepwise nail penetration of a gel electrolyte solid-state battery
Comparing the 10 Hz EIS data extracted throughout the penetration process against the synchronously recorded temperature curves shows that EIS responds to an internal short circuit significantly earlier than surface temperature, with a lead time ranging from tens of seconds to several minutes. This confirms the feasibility of using EIS for early failure warning. The underlying mechanism is that impedance reflects near-instantaneous electrical changes at the site of the short circuit (equivalent parallel resistance, interfacial reactions), while surface temperature must first accumulate heat and then conduct it to the sensor location, introducing an inherent thermal lag that a purely electrical measurement does not have.
The rapid sampling capability of the IEST BIT7000 impedance tester enabled real-time impedance tracking throughout the nail penetration process. Based on the results presented here, a database of impedance signatures for different failure modes could be established; when characteristic changes such as a sudden drop or irregular fluctuation in the 10 Hz imaginary part are detected, a short-circuit warning can be triggered. This provides a technical approach for power battery safety management that is earlier and more sensitive than conventional temperature monitoring alone.
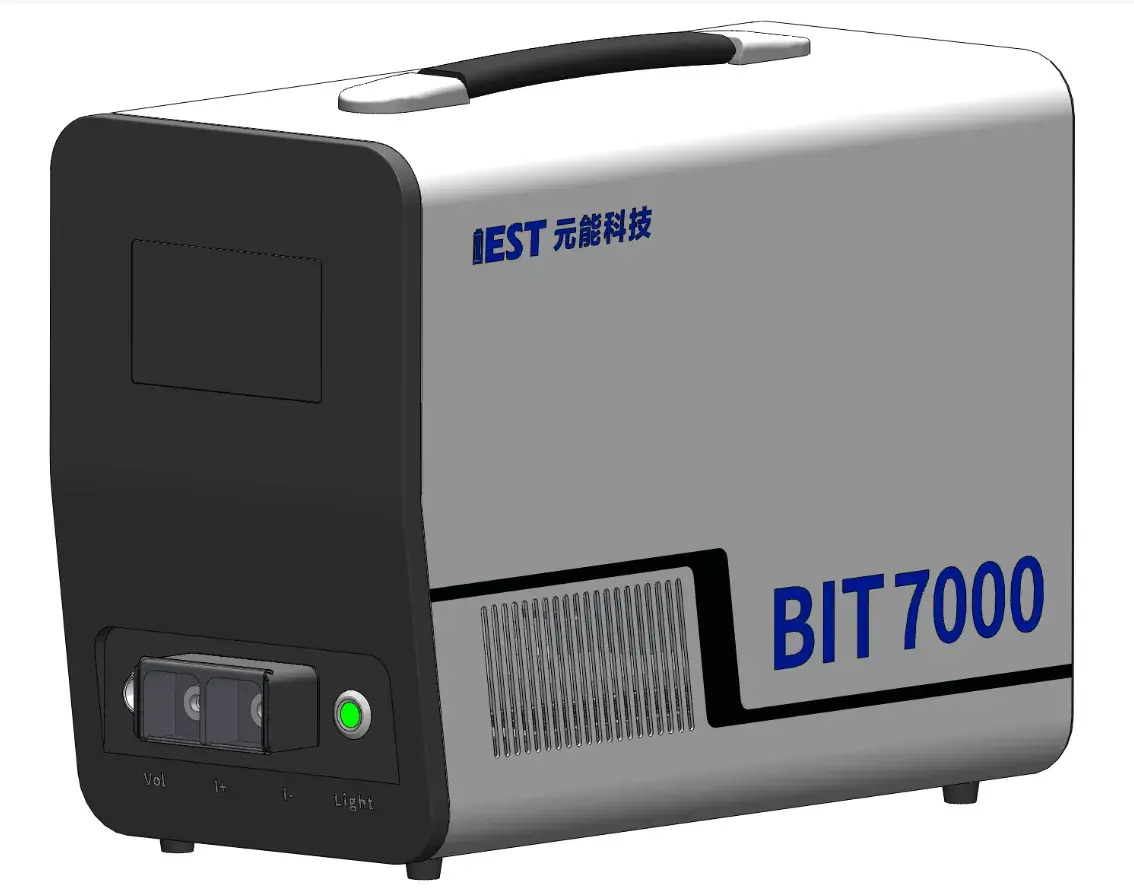
Figure 4. IEST BIT7000 battery impedance tester product
The IEST BIT7000 impedance tester supports rapid, single-frequency impedance sampling across a 20 kHz to 10 mHz range, suited to real-time monitoring during nail penetration, crush, and other mechanical abuse tests.
Real-time EIS evolution refers to continuously measuring a battery’s impedance at a fixed characteristic frequency throughout a nail penetration test, rather than taking a single measurement before or after. In this study, tracking the 10 Hz imaginary part throughout penetration revealed impedance changes that preceded surface temperature changes by tens of seconds to several minutes.
Fast full penetration drives the needle completely through the cell in one motion, simulating sudden mechanical damage, and produced a sharp drop-and-rebound impedance signature in this study. Stepwise penetration advances the needle 1 mm at a time with rest periods between steps, simulating progressive damage, and produced an overall declining impedance trend with irregular fluctuations at each step.
The 10 Hz frequency was selected within the IEST BIT7000‘s 20 kHz to 10 mHz test range because its impedance response is sensitive to the interfacial and charge-transfer changes associated with a developing internal short circuit, and measuring at a single frequency allows fast, repeated sampling throughout a penetration test rather than a slower full frequency sweep.
In this study, comparing the 10 Hz EIS imaginary part against synchronously recorded nine-point surface temperature data showed that the EIS response led surface temperature by tens of seconds to several minutes, because impedance reflects the short-circuit event directly, while surface temperature requires heat to accumulate and conduct to the sensor location first.
Nine K-type thermocouples are arranged in a 3×3 array across the cell surface to capture both central and edge temperature behavior, while the IEST BIT7000 simultaneously records the 10 Hz impedance signal. Recording both data streams synchronously allows the timing of the electrical (EIS) and thermal (temperature) responses to a short circuit to be directly compared.
