-
iestinstrument

Abstract
1. Why Battery Engineers Keep Mixing Up These Three Terms
Walk through any battery R&D or production floor and a few conversations repeat themselves: “Why is this material’s conductivity so poor?” “Why is this batch battery internal resistance is too high — is something wrong with the process?” “Why did the EIS grow during cycling?” These questions all point to related but non-identical electrical properties of a battery. They share some characteristics and differ in others. This article looks at the testing side of “resistance,” “internal resistance,” and “impedance” — what each one means and how each affects battery performance.
2. Standard Definitions: What the Terminology Actually Says
Referencing several national standard documents that define resistance, battery internal resistance, and impedance, the differences among the three are summarized in Table 1.
| Comparison Dimension | Resistance (R) | Internal Resistance (R) | Impedance (Z) |
|---|---|---|---|
| Definition | A resistor is defined as “a two-terminal device essentially characterized by its resistance” | “The sum of the resistances of the electrolyte, cathode/anode electrode groups, separator, and other components inside a battery” | “The complex ratio, at a given frequency, of the AC voltage applied to a system to the corresponding current through it” |
| Applicable Object | General — conductors, resistors, and other two-terminal devices | Specific to batteries (cells) | General, especially for AC / electrochemical systems |
| Related Standards | GB/T 2900.83-2008 | GB/T 19596-2017, GB/T 36945-2018 | GB/T 39482.1-2023 |
| Symbol / Unit | R, ohm (Ω) | Ohm (Ω), following the resistance unit | Z, complex number |
| Core Use | Measures opposition to DC current | Relates to a battery’s heat generation, power, and efficiency | Analyzes resistive/reactive characteristics in AC circuits |
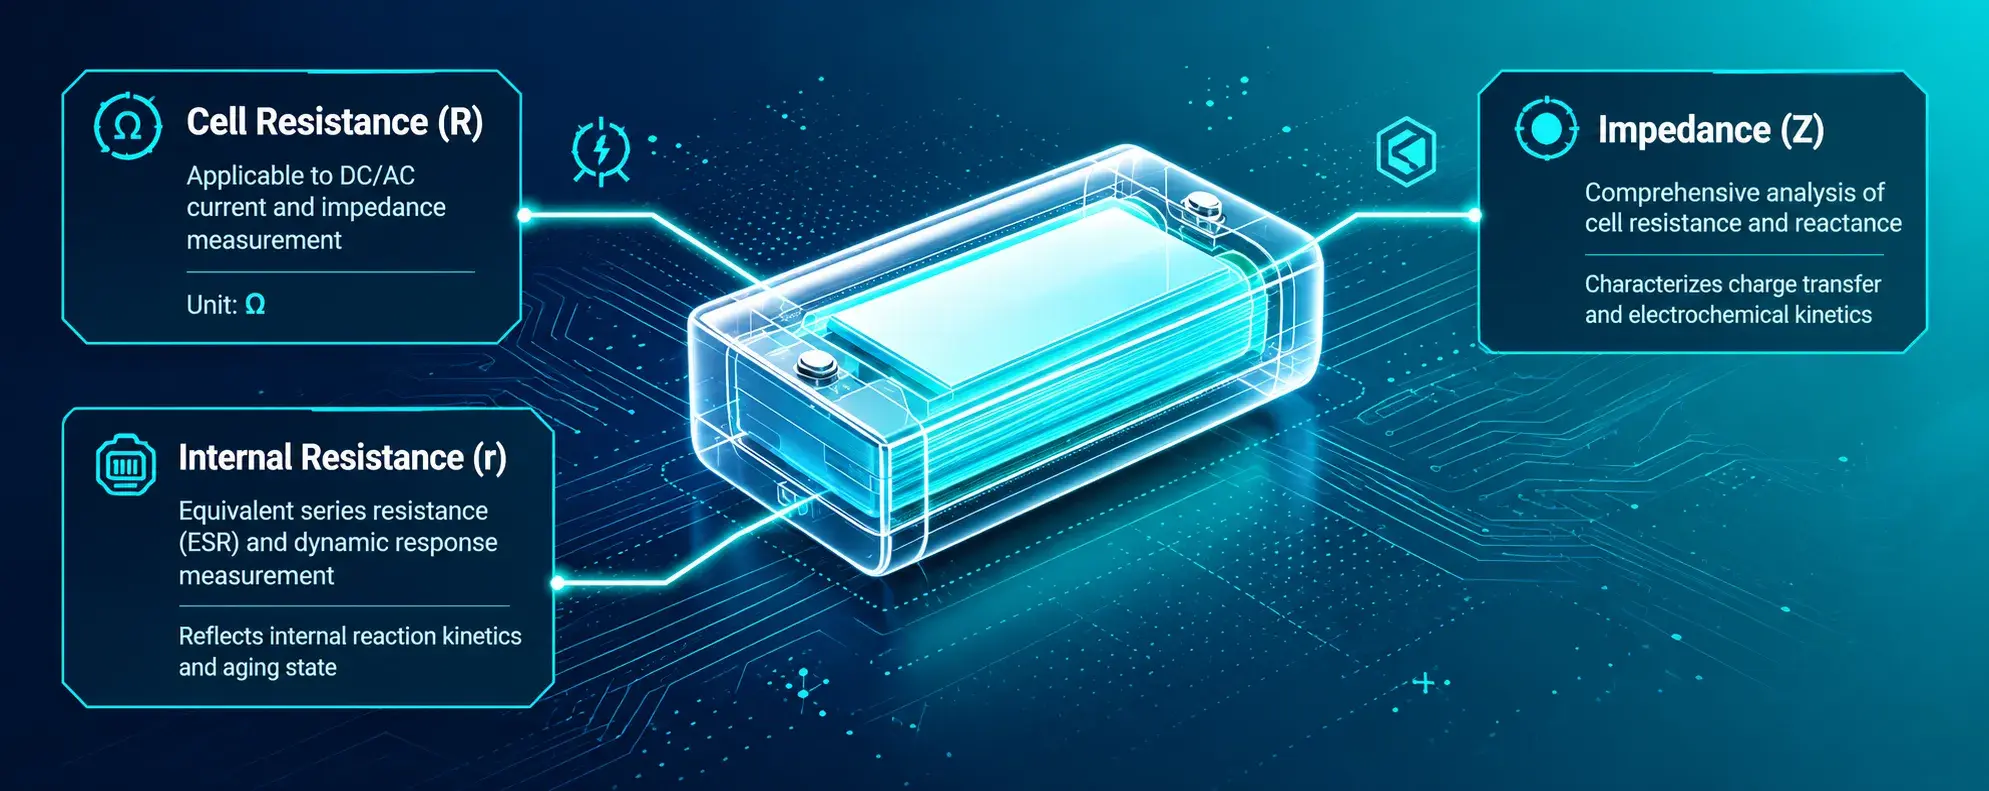
Figure 1. Conceptual comparison of resistance (R), internal resistance (r), and impedance (Z) as three related but distinct electrical parameters of a lithium-ion battery.
3. How Resistance Is Tested for Battery Materials and Electrodes
Resistance is commonly used to evaluate battery materials and coated electrodes, for example as material resistivity or electrode resistivity. Testing applies a DC excitation using either a two-probe or four-probe connection, both based on the Kelvin four-wire method: the voltage across, and current through, the sample are measured, resistance is calculated from Ohm’s law, and resistance is converted to resistivity using the sample thickness.
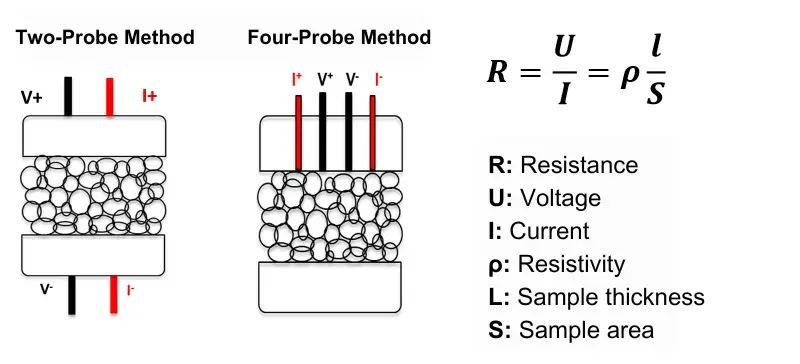
Figure 2. Two-probe and four-probe (Kelvin four-wire) measurement configurations used to calculate resistivity from $R = U/I = \rho \dfrac{l}{S}$.
Lithium iron phosphate ($LiFePO_{4}$, LFP) cathode material is a representative example: its resistivity under different pressures falls within roughly 20 Ω·cm to 100 Ω·cm. Surface modification or coating of the material changes this resistivity to some degree, which in turn changes the electron-conducting network within the coated electrode. Electrode resistance then shifts accordingly, ultimately affecting the battery’s rate capability.
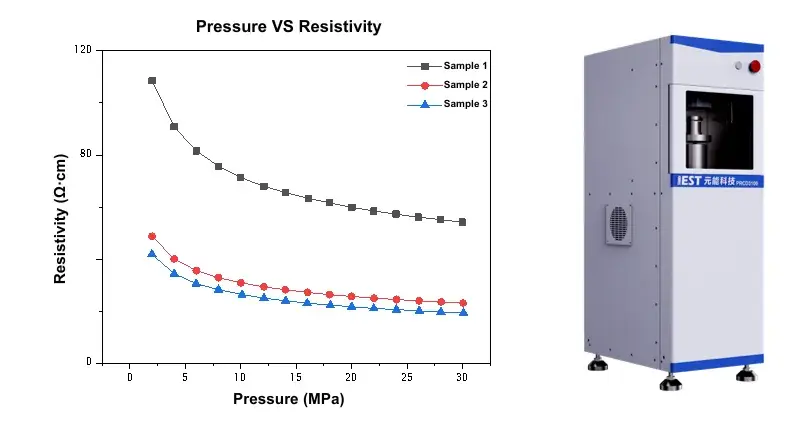
Figure 3. Three LiFePO4 (LFP) cathode material samples measured by the IEST PRCD3100 powder resistivity tester, demonstrating decreasing resistivity (within the 20–100 Ω·cm range) as compaction pressure increases.
4. DC Internal Resistance (DCIR) Testing
Internal resistance generally refers to the sum of all resistive components inside a battery. It is one of the most common measurements in battery production, sorting, and evaluation, and is primarily obtained through DC and AC methods.
DCIR testing simulates a battery’s actual operating condition by applying a relatively large DC current pulse and measuring the instantaneous voltage change ($\Delta V$) it produces. Because DCIR captures both ohmic and polarization resistance, it more closely reflects how a battery performs under high-current operation.
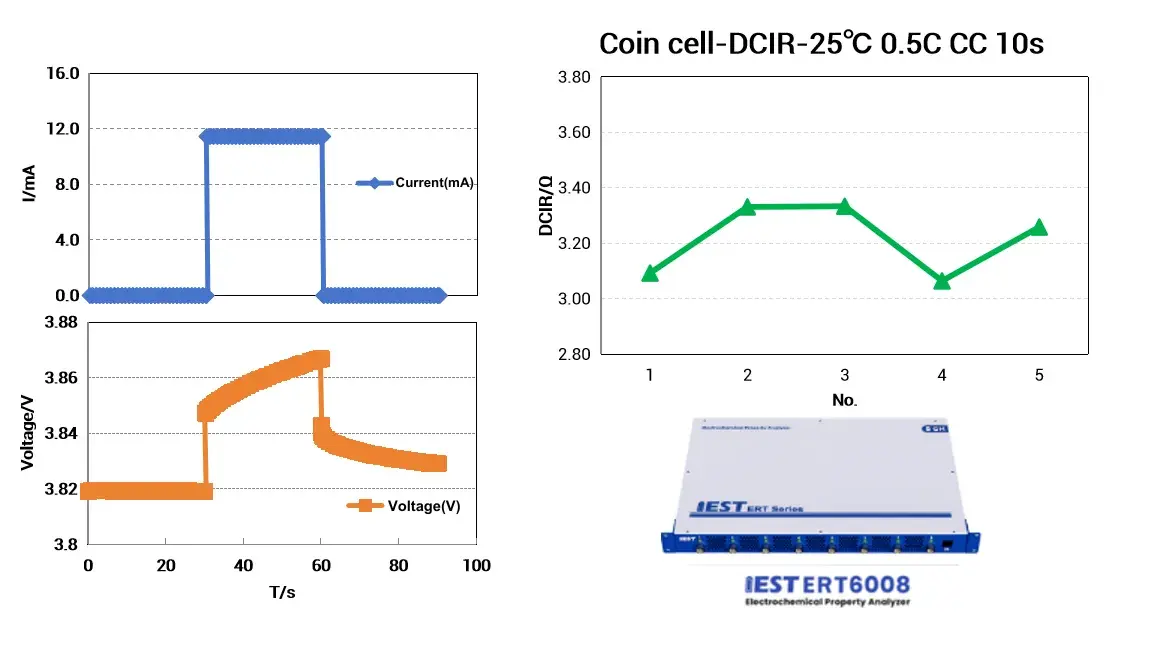
Figure 4. Coin cell measured by the IEST ERT6008 electrochemical property analyzer, demonstrating DC internal resistance (DCIR) obtained from a 0.5C constant-current pulse for 10 seconds at 25°C.
5. AC Internal Resistance (ACR) Testing
ACR is a faster screening method. Since the excitation frequency is high, the measurement has minimal impact on the cell and can be completed quickly, which makes it well suited to fast, consistency-focused screening of cells on a production line.
6. DCR vs ACR: Testing Matrix and Design Implications
| Testing Dimension | DC Internal Resistance (DCR) | AC Internal Resistance (ACR) | Implication for Fast-Charging & Cell Design |
|---|---|---|---|
| Excitation Signal | Large DC current pulse (charge or discharge) | Small AC signal, typically a 1 kHz sine wave | DCR requires active load equipment; ACR uses simple AC milliohm meters |
| Resistance Components | Ohmic resistance + polarization resistance | Predominantly pure ohmic resistance ($R_\Omega$) | DCR reflects real voltage sag under load; ACR reflects only the passive hardware baseline |
| Speed & Impact | Slower (1–30 s pulse); alters local lithium concentration | Ultra-fast (<100 ms); zero disturbance to cell SOC | ACR is optimal for high-throughput factory sorting; DCR is required for BMS algorithm calibration |
| Typical Application | Dynamic power rating, thermal modeling, fast-charge verification | End-of-line production sorting, weld quality inspection | DCR is the essential metric for EV pack thermal management sizing |
7. Electrochemical Impedance Spectroscopy (EIS): Decoupling Internal Resistance
Electrochemical Impedance Spectroscopy (EIS) is an advanced electrochemical analytical technique. By applying a small AC perturbation across a wide frequency range (e.g., 10 µHz to 1 MHz) to the battery cell, it measures the impedance response at varying frequencies. EIS can “decouple” the total internal resistance of the cell and resolve it into distinct components—such as ohmic resistance in the high-frequency region, charge transfer resistance in the medium-frequency region, and diffusion impedance (Warburg impedance) in the low-frequency region. This is vital for analyzing battery degradation mechanisms and evaluating SEI film properties. Furthermore, for solid-state electrolyte materials where ionic conductivity is of paramount interest, EIS testing is widely utilized to determine key ionic conductivity parameters.
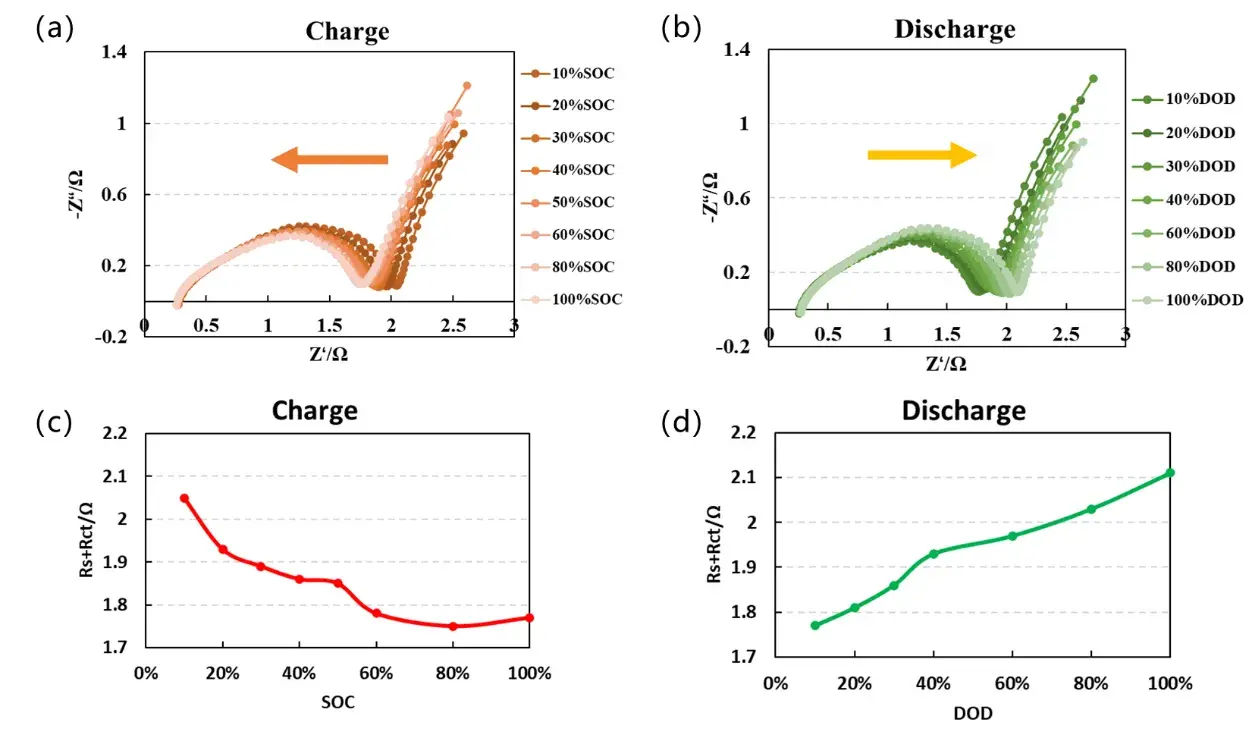
Figure 5. Coin cell evaluated by electrochemical impedance spectroscopy (EIS), showing Nyquist plots (–Z″ vs Z′) at 10%–100% state of charge (SOC) during charge and 10%–100% depth of discharge (DOD) during discharge, with the combined surface-and-charge-transfer resistance ($R_s+R_{ct}$) decreasing from roughly 2.05 Ω to 1.77 Ω on charge and increasing from roughly 1.77 Ω to 2.11 Ω on discharge.
8. Using EIS to Evaluate Solid Electrolyte Ionic Conductivity
For solid electrolyte materials, the property of greatest concern is ionic conductivity, and it is likewise obtained through EIS testing, with the ionic conductivity parameter calculated from the resulting impedance data.
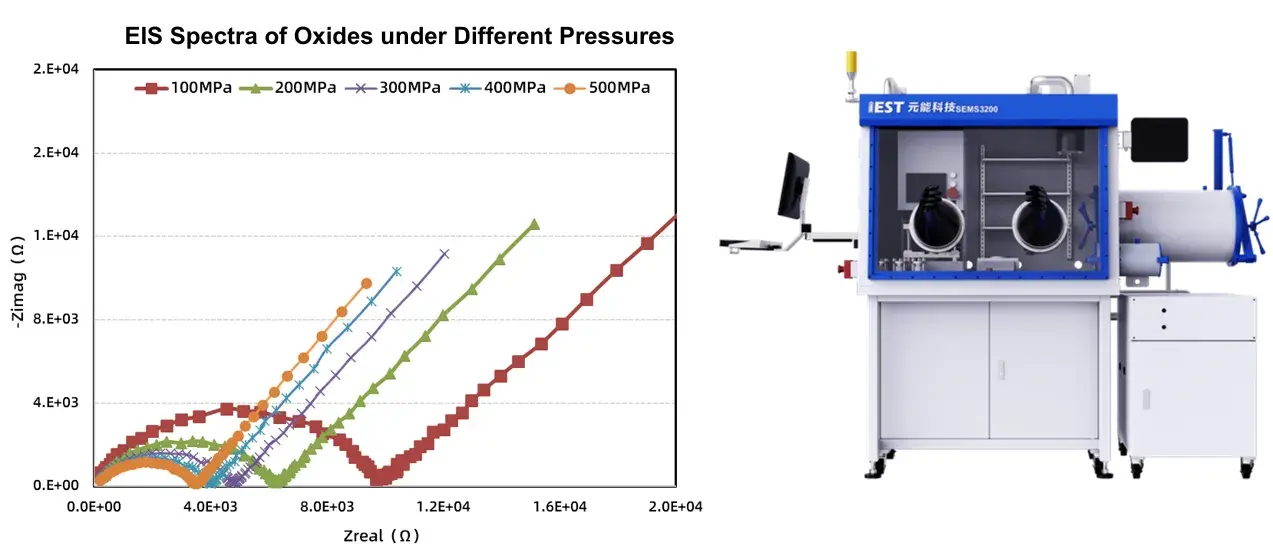
Figure 6. Oxide-type solid electrolyte measured by the IEST SEMS3200 solid-state electroly tetest system, demonstrating EIS spectra (Nyquist plots) under compaction pressures from 100 MPa to 500 MPa, used to derive ionic conductivity.
9. So Which Parameter Actually Matters Most?
In summary: to assess a material’s conductivity, look at resistance. To assess the total resistance inside a cell, look at battery internal resistance. To decouple that internal resistance into its component parts, look at impedance (EIS). All three affect battery performance, directly or indirectly, at different levels of the system, and which one takes priority depends on the research object and the purpose of the test.
If you work in the battery industry, which of these parameters do you use most often — resistance (R), internal resistance (DCR/ACR), or impedance (EIS)?
10. IEST Instrument Testing Solutions Across Resistance, DCIR, and EIS
IEST Instrument’s resistivity, DCIR, and impedance test systems are built to keep pressure, temperature, and current parameters controlled and traceable across each of the measurement types discussed above. The IEST PRCD3100 powder resistivity tester applies the two-probe and four-probe configurations shown in Figure 2 under a controllable compaction pressure to generate resistivity-versus-pressure curves such as those in Figure 3. The IEST ERT6008 electrochemical property analyzer runs pulse-based DCIR protocols — for example, a 0.5C constant-current pulse for 10 seconds at 25°C, as shown in Figure 4 — for cell-level internal resistance screening. The IEST SEMS3200 solid-state battery test system integrates a controlled-atmosphere glovebox with multi-frequency EIS measurement under mechanical pressures from 100 MPa to 500 MPa (Figure 6), supporting ionic conductivity evaluation for oxide-type solid electrolytes.
🔬 Testing Resistance, DCIR, or EIS in Your Lab or Production Line?
IEST Instrument’s PRCD3100, ERT6008, and SEMS3200 platforms cover material/electrode resistivity, cell-level DCIR/ACR, and multi-frequency EIS for solid and liquid electrolyte systems. Contact IEST Instrument’s engineering team to discuss which test protocol fits your material, cell format, or R&D requirement
11. References
[1] GB/T 31486-2015, Electric Performance Requirements and Test Methods of Lithium Ion Batteries for Electric Vehicles
[2] GB/T 31485-2015, Safety requirements and test methods for traction battery of electric vehicle
[3] GB/T 31467, Electrical performance test methods for Iithium-ion traction battery pack and system of electric vehicles
[4] GB/T 36276-2018, Lithium ion battery for electrical energy storage
[5] GB/T 18287-2013, General specification of lithium-ion cells and batteries for mobile phone
[6] GB/T 36972-2026, Lithium-ion battery for electric bicycle
[7] GB/T 38819-2020, Test Methods for Electrochemical Performance of Lithium-ion Battery Materials
[8] GB/T 45324-2025, Determination of powder resistivity for cathode materials of lithium ion battery
12. FAQs
What is DC internal resistance (DCIR) in battery testing?
DCIR is the internal resistance obtained by applying a DC current pulse, such as a charge or discharge pulse, to a battery and calculating R=ΔV/I from the resulting voltage change. DCIR includes both ohmic and polarization resistance, so it reflects how a cell behaves under real, high-current operating conditions.
What is the difference between internal resistance and impedance (EIS)?
Battery Internal resistance (via DCR or ACR) reports a single resistance value for a cell. Electrochemical impedance spectroscopy (EIS) applies AC signals across a wide frequency range and decouples that same total resistance into ohmic, charge-transfer, and diffusion components, which is useful for aging and SEI analysis.
How do I choose between DCR and ACR testing for battery internal resistance?
Selecting DCR or ACR depends on whether the goal is realistic high-current performance data or fast production-line screening. DCR uses a large current pulse and captures ohmic plus polarization resistance, closer to real operating behavior. ACR uses a small 1 kHz AC signal, is faster, and mainly reflects ohmic resistance, making it suited to rapid consistency screening. IEST Instrument’s ERT series analyzers support both protocols.
What powder resistivity range is typical for LiFePO4 (LFP) cathode material?
Under varying compaction pressure, LiFePO4 cathode material resistivity typically falls within roughly 20 Ω·cm to 100 Ω·cm, measured using two-probe or four-probe Kelvin methods. Surface modification or coating of the material shifts resistivity within this behavior, which subsequently changes electrode resistance and rate capability.
How does electrochemical impedance spectroscopy (EIS) decouple battery internal resistance?
EIS applies a small AC signal across a wide frequency range, for example 10 μHz to 1 MHz, and measures the impedance response at each frequency. The high-frequency region corresponds to ohmic resistance, the mid-frequency region to charge-transfer resistance, and the low-frequency region to diffusion (Warburg) resistance, separating what a single DCR or ACR value cannot.
