

Traditional lithium battery manufacturing predominantly uses wet electrode processing. This method involves mixing active materials, conductive agents, and binders in a solvent, coating the slurry onto a current collector [1], drying, and calendering. The process, especially for cathodes, requires toxic N-methyl-2-pyrrolidone (NMP) solvent, necessitating extensive and energy-intensive recovery systems. Drying and solvent recovery alone account for a significant portion of equipment, labor, and energy costs. Furthermore, the “binder migration” phenomenon during drying can lead to electrode delamination, poor conductive network formation, and reduced adhesion, issues that are exacerbated in thick electrodes.
The dry electrode process eliminates solvent entirely. Key advantages of dry electrode technology include [3]:
No NMP solvent: eliminates toxic waste recovery, reduces factory footprint and capital expenditure
No binder migration: enables more uniform binder and conductive agent distribution without capillary-driven segregation during drying
Shorter process: fewer manufacturing steps vs wet-process electrode preparation, reducing cycle time and cost
Solid-state battery compatibility: dry electrode technology is the preferred electrode preparation process for ceramic/polymer solid electrolyte cells, where solvent compatibility is critical
| Parameter | Wet Electrode Process | Dry Electrode Process |
|---|---|---|
| Solvent | NMP (toxic, requires recovery) | None |
| Binder migration | Yes — causes delamination in thick electrodes | No — uniform distribution |
| Thick electrode capability | Limited — cracking above ~150 μm | Yes — crack-free thick electrodes |
| Energy cost | High (drying ovens, solvent recovery) | Low (no drying step) |
| Solid-state compatibility | Limited (solvent attacks electrolyte) | Yes |
| Key binder type | PVDF (NMP-soluble) | PTFE (fibrillated dry binder) |
Two dry film-forming methods have matured in industry, both relying on a dry electrode binder rather than a dissolved binder system:
PTFE binder fibrillation — Active powder, conductive additive, and PTFE binder[2] (typically 95:3:2 by mass) are mixed, then subjected to high shear to fibrillate the PTFE dry electrode binder into a network of micro/nanofibers that entangle and bind particles into a self-supporting dry electrode film. Roll-pressing consolidates the film and bonds it to the current collector foil. PTFE fibrillation is the current mainstream dry electrode process because it produces films with superior cohesion, flexibility, and process robustness.
Electrostatic powder spraying [4] — Charged powder deposits onto an oppositely charged current collector; the deposited layer is then thermally pressed. Less common in production due to lower cohesion and process consistency compared with PTFE fibrillation.
PTFE fibrillation is currently the mainstream for dry electrodes because it produces films with superior cohesion, flexibility and process robustness compared with electrostatic spraying. Practical fibrillation is performed using equipment such as high-pressure air classifiers (airflow pulverizers), twin-screw extruders or open mills; airflow mills maximize throughput while screw extruders typically give higher yield. Process parameters — feed rate, shear/pressure, and gas injection pressure (for airflow mills) — strongly influence fibrillation quality and ultimately electrode electrical properties.
This study uses two purpose-built instruments from IEST to quantify electrical and packing properties across powder and film processing steps in the dry electrode process:
The PRCD3100 measures in-situ resistivity, electrical conductivity, and compaction density of dry electrode powder while applying controlled uniaxial loads up to 5T. The instrument records resistivity and thickness in real time as pressure is stepped, enabling pressure-dependent in-situ powder diagnostics throughout the dry electrode process.
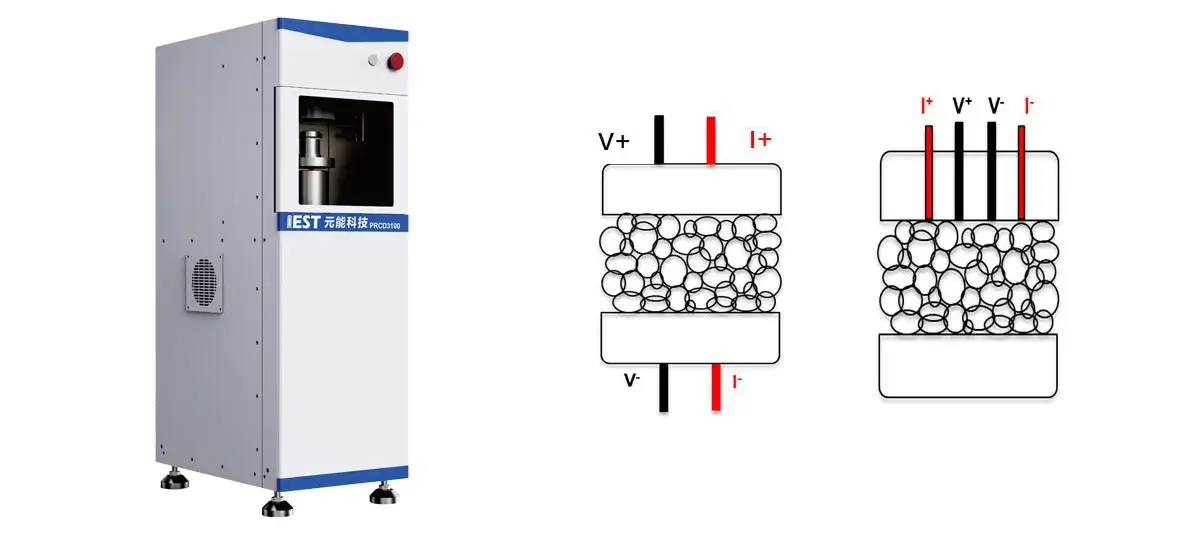
Figure 1. Schematic diagram of the powder resistivity & compaction density meter (PRCD3100, IEST) and two test principles of powder resistivity
The BER2500 measures resistance, resistivity, conductivity, and thickness of dry electrode sheet disks (Ø14 mm) under applied pressures from 5 to 60 MPa. It supports single-point and variable-pressure scans that simulate calendering and in-service contact conditions for dry electrode process optimization.
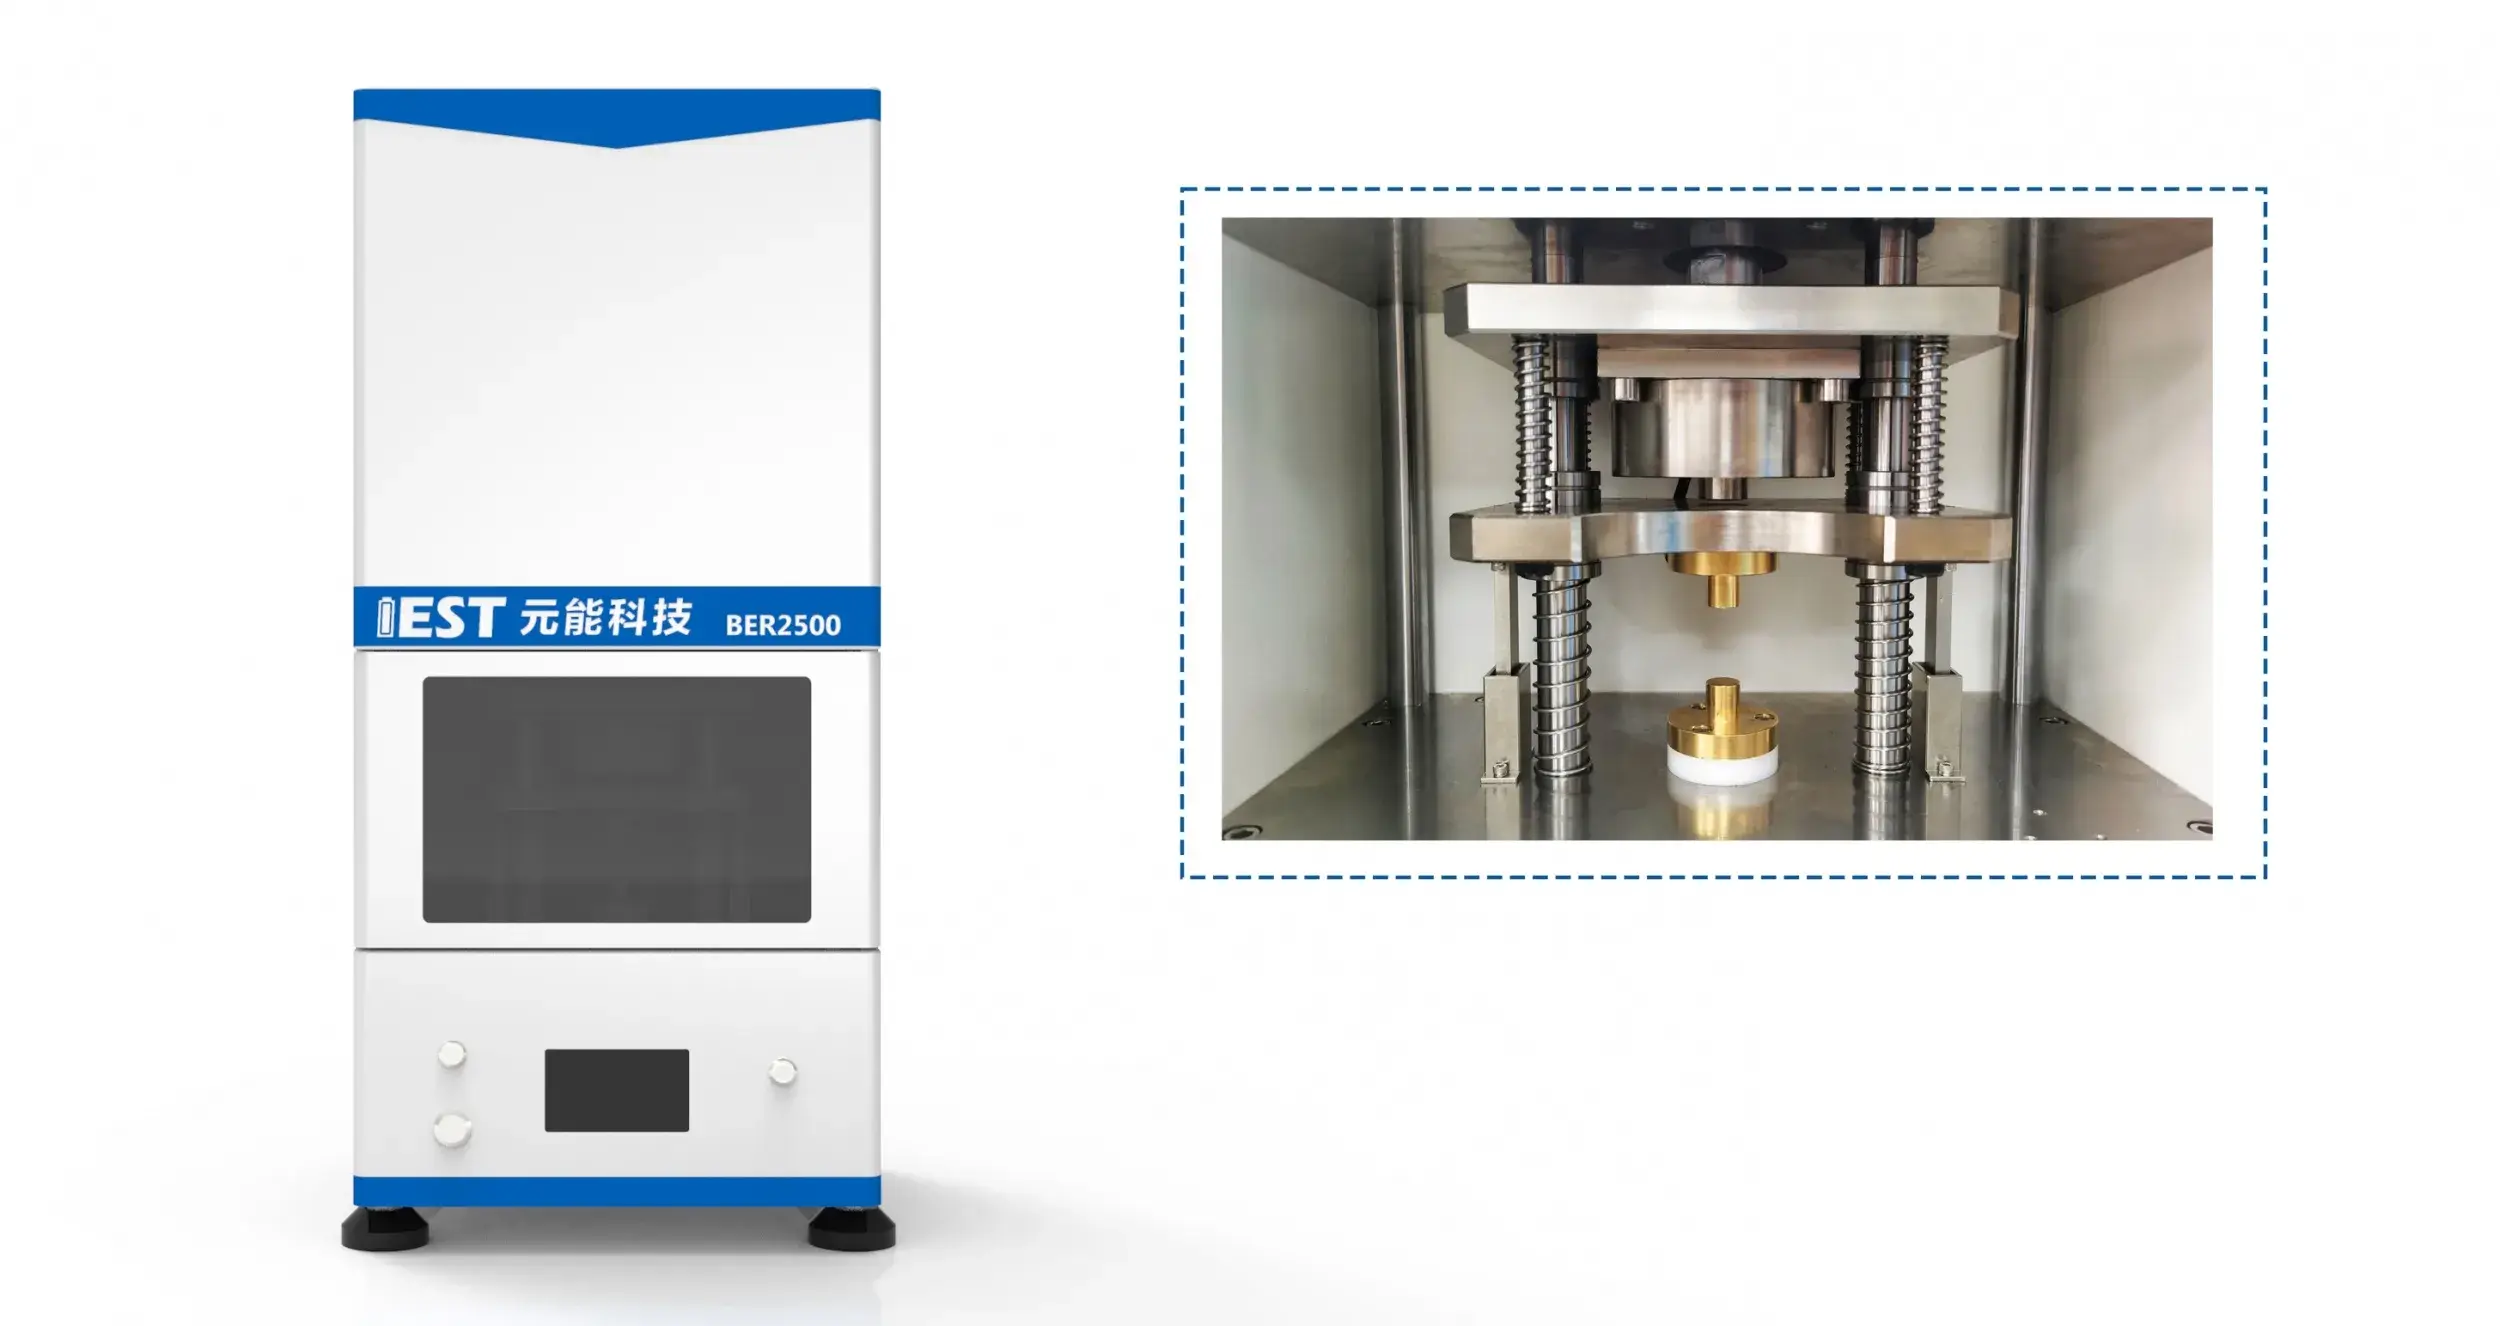
Figure 2. (a) External view of BER2500; (b) Structural diagram of BER2500.
The dry electrode process experimental steps: active particles, conductive agents, and PTFE binder are mixed in a V-type mixer at a 95:3:2 mass ratio. The uniformly blended powder is then fibrillated in an airflow pulverizer (jet mill). Different feed rates produce different degrees of PTFE binder fibrillation. After fibrillation, the negative dry electrode powder is roll-pressed under different pressures to form a self-supporting dry electrode film (dry coating electrode sheet).
Prepare two sets each of cathode and anode dry electrode powders (Cathode-1, Cathode-2, Anode-1, Anode-2) — fibrillated at different feed rates: Cathode-1 > PCathode-2 and Anode-1 > Anodee-2.
Apply pressure stepwise from 6 to 350 MPa in 20 MPa increments, holding for 10 seconds at each step. The PRCD3100‘s four-probe module and thickness sensor record in-situ resistivity and compaction density continuously under each pressure level.
Prepare anode dry electrode sheets prepared under different roll pressing pressures for single-point testing, named Anode-1 and Anode-2. Prepare a set of stable production process cathode and anode electrode sheets for variable pressure testing.
Single-point testing: Set up testing parameters in the MRMS software, select single-point testing mode with a pressure of 5 MPa and a holding time of 15 seconds. Sample 6 data points per electrode sheet, with the software automatically recording thickness, resistance, resistivity, conductivity, and other data.
Higher feed rates during airflow fibrillation consistently produce dry electrode powders with lower in-situ resistivity and higher compaction density — directly reflecting improved PTFE binder fibrillation and conductive network formation. Figure 3 compares in-situ resistivity and compaction density results for cathode and anode dry electrode powders prepared at different feed rates (Anode-1 > Anode-2 and Cathode-1 > Cathode-2):
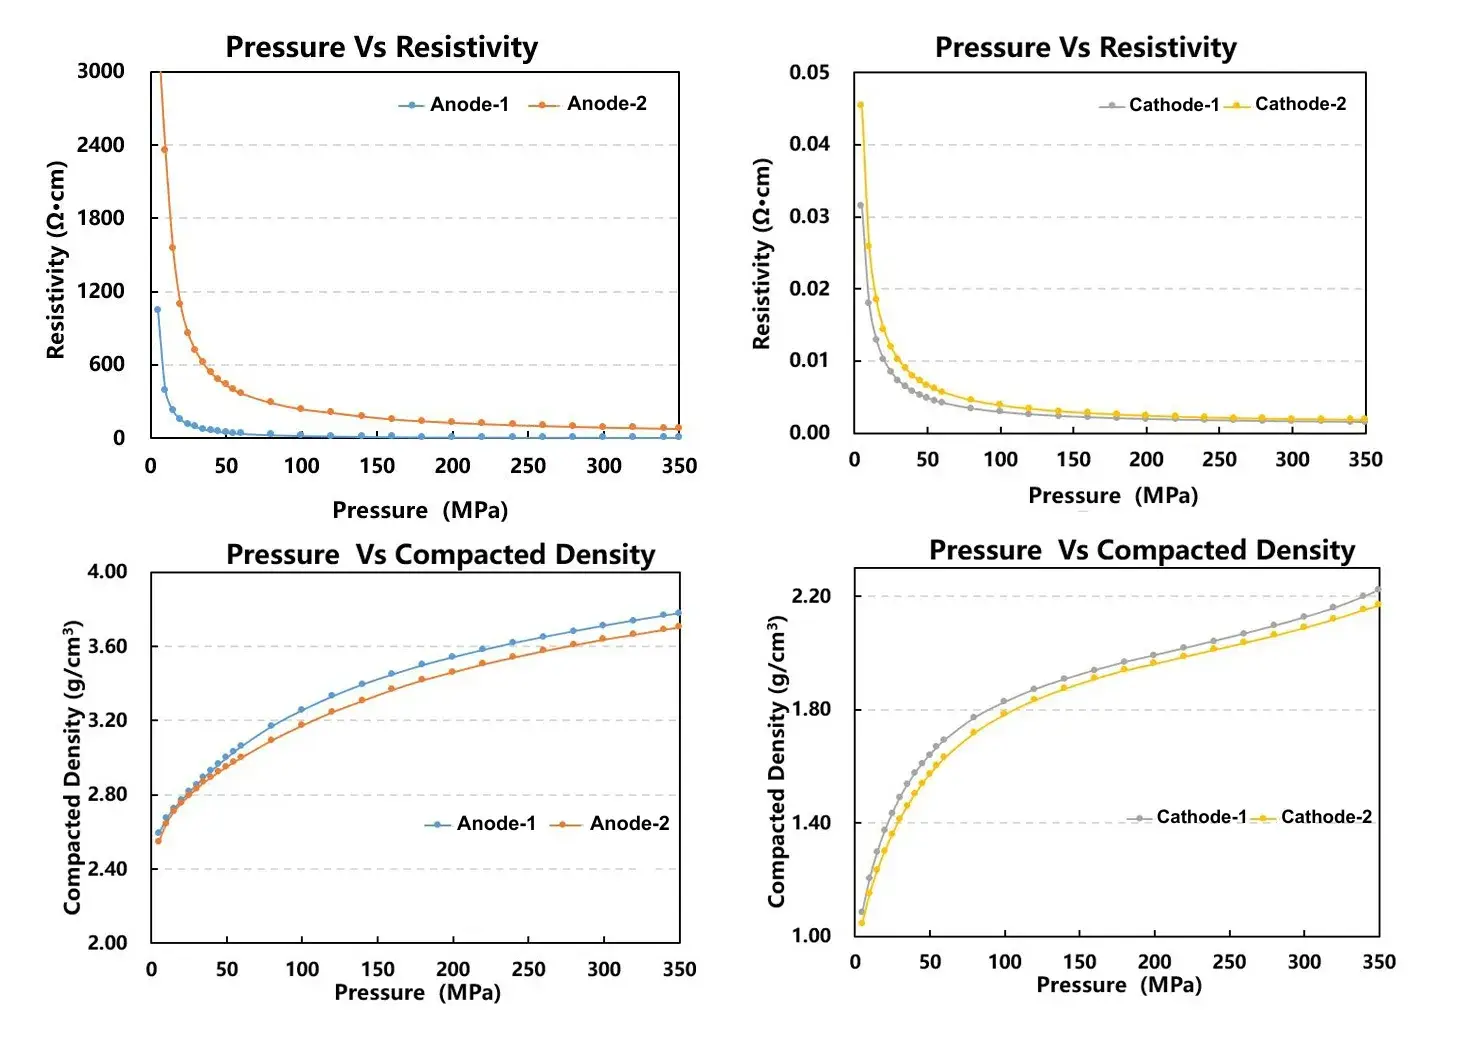
Figure 3. Comparison of in-situ resistivity and compaction density test results for cathode and anode dry electrode powders at different feed rates.
Calender pressure is directly and monotonically correlated with dry electrode sheet resistivity — higher calender pressure produces lower resistivity and more uniform dry electrode sheets. Figure 4 illustrates resistivity and thickness test results for cathode dry electrode sheets calendered at different pressures (Cathode-1 > Cathode-2 in roll-press pressure):
Increasing roll-press pressure reduces electrode thickness and increases compaction density, yielding a clear reduction in dry electrode sheet resistivity.
Higher calender pressure also improved measurement repeatability — the coefficient of variation (COV) for resistance decreased at higher nip pressures, indicating more uniform dry electrode coating and lower statistical dispersion across measured points.
Variable-pressure BER2500 scans of both cathode and anode dry electrode sheets show monotonic resistivity decline as applied pressure increases — confirming that the variable-pressure test can emulate calendering and rapidly identify target compaction ranges for a given formulation.
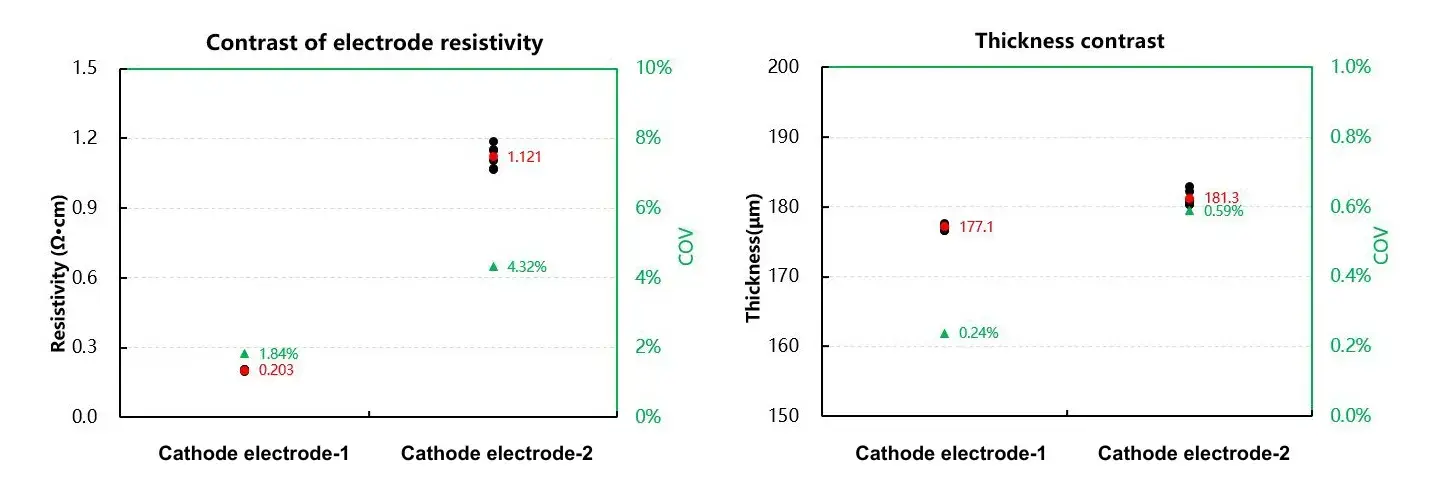
Figure 4. Comparison of resistivity and thickness test results for cathode dry electrode sheets at different roll-press pressures (Cathode-1 > Cathode-2).
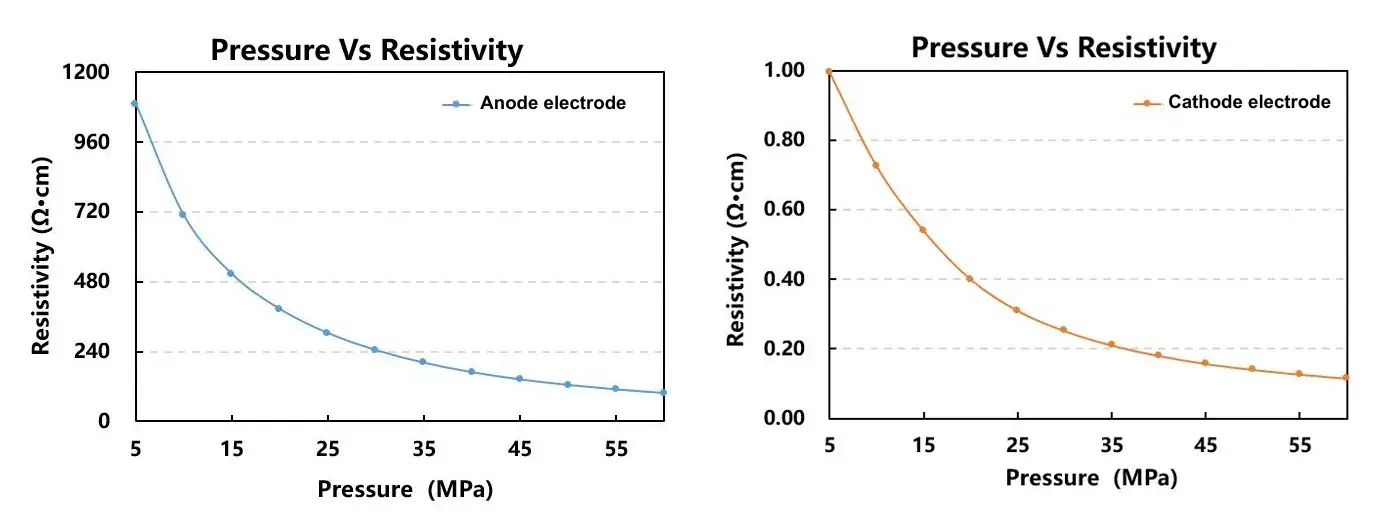
Figure 5. Variable-pressure test results for cathode and anode dry electrode sheets — resistivity decreases monotonically with applied test pressure, indirectly simulating calender pressure effects.
Figure 5 shows the variable pressure test results for cathode and anode dry electrode sheets. The test results indicate that the resistivity of the electrode sheets decreases with increasing test pressure, indirectly simulating the changes in resistivity under different roll pressing pressures. This testing method can assist researchers in quickly identifying the optimal compacted density suitable for the material, thereby saving research and development testing time.
Based on the diagnostic workflow and observed correlations, the following practical actions are recommended for R&D and pilot lines using the dry electrode process:
Control PTFE binder feed rate during fibrillation — Use feed-rate maps to target PTFE fibrillation states that minimize dry electrode powder in-situ resistivity, while avoiding over-fibrillation that could reduce film porosity excessively.
Use PRCD3100 pressure sweeps to determine the pressure window where dry electrode powder resistivity exhibits the strongest improvement; choose downstream calender setpoints accordingly.
Employ BER2500 variable-pressure scans on pilot dry electrode sheets to validate that calendering yields consistent resistivity and thickness at production pressures (5–60 MPa).
Track COV as a uniformity index (mean resistance, standard deviation, COV) across multiple sampling points per dry electrode sheet to detect formulation or process drift early.
Document process interactions (fibrillation degree × calender pressure) — both steps jointly determine final dry electrode sheet impedance, adhesion, and energy density.
This study demonstrates how systematic in-situ resistivity measurement using the PRCD3100 and BER2500 provides critical insights for optimizing the dry electrode process:
In the fibrillation stage, a higher jet mill feed rate — associated with greater PTFE binder fibrillation — produces dry electrode powders with lower in-situ resistivity and higher compaction density.
In the calendering stage, higher roll-press pressure produces dry electrode sheets with lower resistivity and better consistency (lower COV).
Variable-pressure BER2500 testing offers an efficient method for screening optimal compaction parameters for any dry electrode formulation without running a full calender pressure matrix.
Dry electrode technology represents a significant advance over traditional wet processing, offering a shorter, more cost-effective, and environmentally friendly manufacturing route. It enables higher energy density and superior mechanical properties, making it particularly suitable for solid-state cells, 4680 cylindrical cells, and next-generation thick-electrode battery designs. The metrology workflow demonstrated here — combining PRCD3100 in-situ resistivity with BER2500 elect
[1] Li Qingying et al., Dry preparation technology of electrodes and related materials [J] CHINESE JOURNAL OF RARE METALS, 2023, Vol.47 No.12 1705~1715.
[2] DUONG H,SHIN J,YUDI Y. Dry electrode coating technology[A]. 48th Power Sources Conference[C]California: Maxwell Technologies,Inc.,2018: 34-37.
[3] Li Yongxing, et al. Progress in solvent-free dry-film echnology for batteries and supercapacitors[J]. Materials Today,2022.
[4] Al-Shroofy M, Zhang Q, Xu J, et al. Solvent-free dry powder coating process for low-cost manufacturing of LiNi 1/3 Mn 1/3 Co 1/3 O 2, cathodes in lithium-ion batteries[J]. Journal of Power Sources, 2017, 352:187-193.
The dry electrode process is a solvent-free manufacturing route where active material, conductive additive, and a PTFE dry electrode binder are mixed and directly compressed onto a current collector without any NMP coating, drying oven, or solvent recovery step. In contrast, wet electrode processing dissolves PVDF binder in NMP, coat-dries it, and requires extensive energy-intensive NMP recovery. The dry electrode process eliminates these costs and enables crack-free thick electrodes that wet-process slurry cannot produce — making dry electrode technology the preferred route for solid-state cells, 4680-format cylindrical cells, and high-energy-density thick electrodes.
PTFE (polytetrafluoroethylene) is the dry electrode binder of choice because it can be mechanically fibrillated under high shear into a network of nanofibers that entangle and bind active particles without dissolving in any solvent. In PTFE binder fibrillation, the dry electrode binder begins as 100–200 µm granules that are progressively elongated under shear into primary micron-scale fibers and then secondary nanofibers. Well-fibrillated PTFE forms nanofiber sheaths around active particles, improving particle-to-particle contact and enabling a continuous percolating conductive network — which reduces bulk dry electrode powder in-situ resistivity and increases compaction density. The degree of PTFE fibrillation is controlled primarily by jet mill feed rate and shear conditions in the dry electrode process.
In-situ resistivity measurement in the dry electrode process uses a four-probe resistance testing module integrated into a controlled-pressure compaction cell — such as the IEST PRCD3100 — that records powder resistivity and compaction density simultaneously as pressure is stepped from 6 to 350 MPa in real time. This is fundamentally different from post-compaction resistance measurement: in-situ resistivity captures how the conductive network evolves with increasing compaction pressure, revealing the pressure range where resistivity improves most steeply and identifying the target calender pressure for a given dry electrode formulation.
Increasing roll-press (calender) pressure in the dry electrode process reduces electrode thickness and increases compaction density, producing a clear monotonic decrease in dry electrode sheet resistivity. In this study, higher calender pressure also improved measurement repeatability — the COV (coefficient of variation) for resistance decreased at higher nip pressures, indicating more uniform dry coating electrode contact and conductive network continuity. Variable-pressure BER2500 scanning from 5 to 60 MPa emulates the calendering effect and can rapidly identify the optimal target compaction range for any dry electrode formulation without running a full calender pressure matrix.
Optimizing the dry electrode process requires in-situ resistivity measurement at both the powder stage and the electrode sheet stage. The IEST PRCD3100 Powder Resistivity & Compaction Density Tester measures dry electrode powder in-situ resistivity and compaction density from 6–350 MPa in real time, enabling feed-rate and fibrillation optimization at the powder stage. The IEST BER2500 Battery Electrode Resistance Tester measures dry electrode sheet resistivity, thickness, conductivity, and COV at 5–60 MPa (single-point or variable-pressure scan), validating calender pressure selection and process consistency at the film stage. Together, these instruments provide a complete metrology workflow for the dry electrode process from PTFE binder fibrillation through to final dry electrode sheet qualification.
