-
iestinstrument
Pouch Cell In-situ Analysis of the Volume and Thickness Swelling Behavior
1. Preface
For lithium-ion batteries encapsulated with aluminum-plastic film or steel shell, due to the limitation of external space, the volume swelling during charging and discharging will cause different degrees of stress inside the battery, which will affect the battery capacity, rate, safety performance, etc. Therefore, controlling the lithium volume swelling of the ion battery is the key point to ensure the safety and reliability of the battery cell. Pouch cell swelling is divided into reversible swelling and irreversible swelling. Among them, the reversible swelling comes from the structural swelling caused by the lithium ion de-intercalation process and the thermal swelling caused by the thermal effect of the battery, and the irreversible swelling comes from gas production or irreversible structural phase change 1-5。In this paper, from the two perspectives of cell volume and cell thickness, as shown in Figure 1 (a) and (b), the in-situ method is used to monitor the swelling change during charging and discharging and analyze the pouch cell swelling behavior.
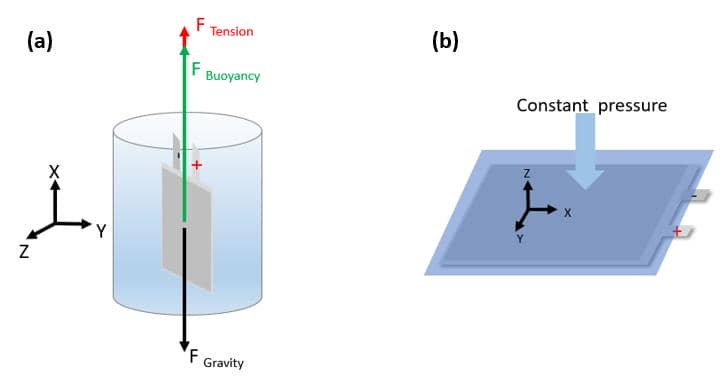
Figure 1. Test schematic: (a) Volume Test; (b) Thickness Test
2. Experimental Equipment and Test Methods
2.1 Key Instruments
To accurately measure pressure and dimensional changes in a pouch cell, advanced in-situ instruments are required.
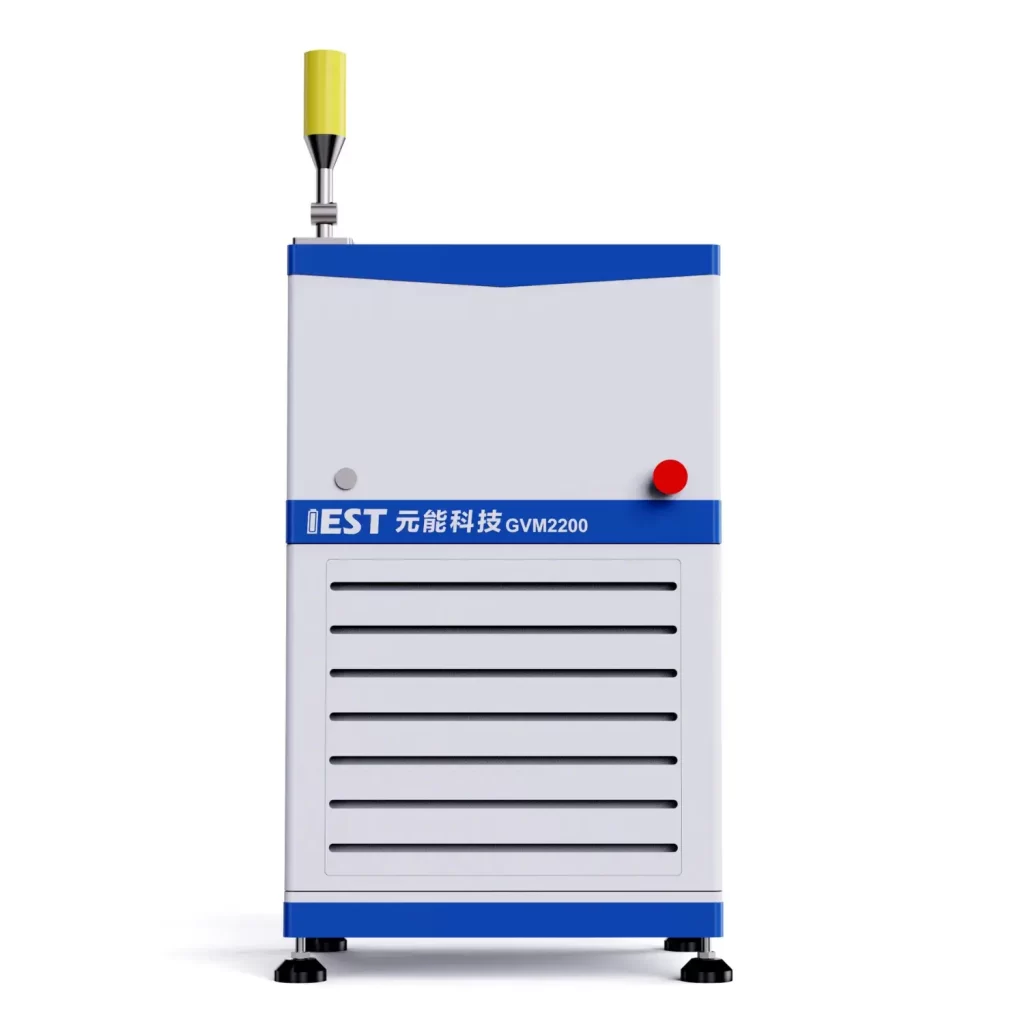
2.1.1 In-situ Gas & Volume Monitor (GVM2200 – IEST)
• Temperature range: 20 °C – 85 °C.
• Dual-channel synchronous testing (two pouch cells simultaneously).
• Continuously records cell volume, gas evolution, temperature, voltage, current and capacity.
The appearance of the device is shown in Figure 2.
Figure 2. Appearance of GVM2200 Equipment
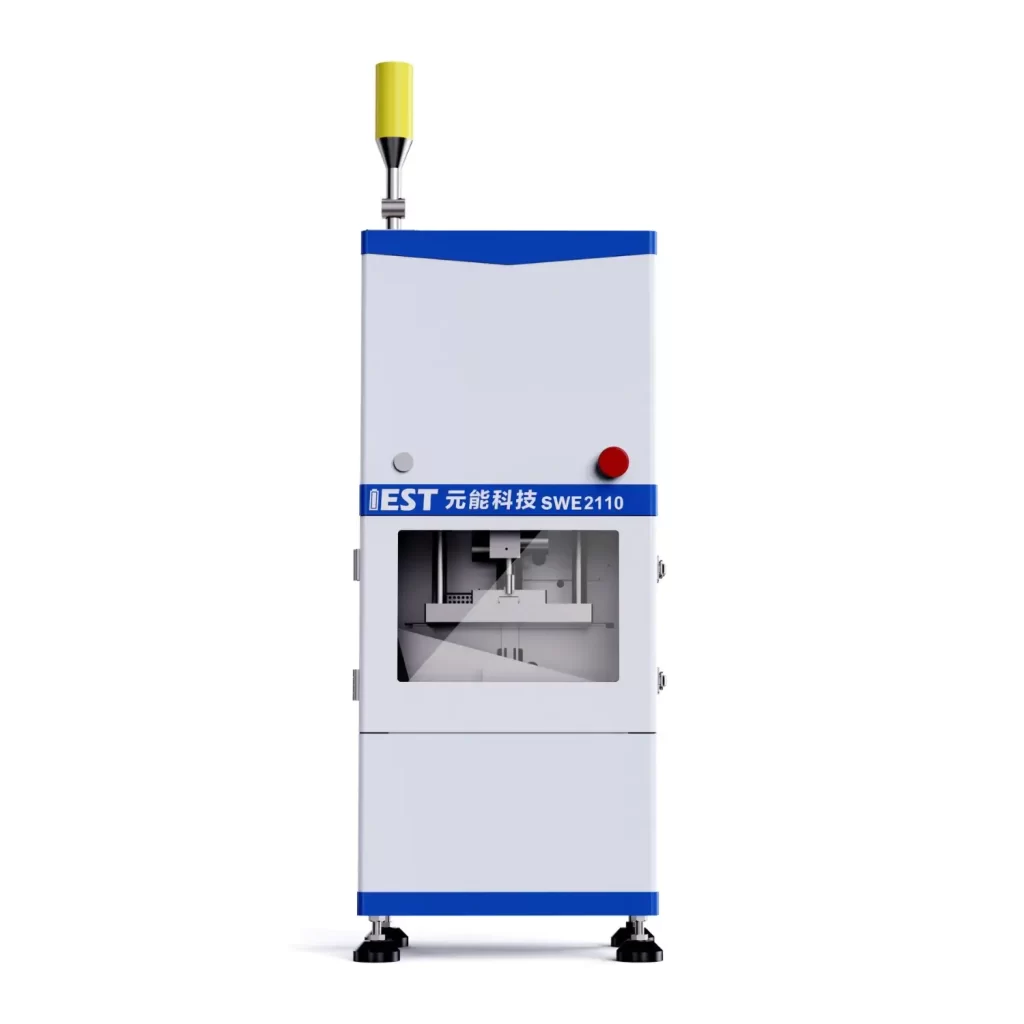
2.1.2 In-situ Swelling Analyzer (SWE2110 – IEST)
The SWE2110 directly measures the thickness change of a pouch cell under a defined applied pressure. This is critical because it allows researchers to measure pressure-dependent swelling behavior, simulating the mechanical constraints found in a real battery pack. The appearance of the equipment is shown in Figure 3.
Figure 3. Appearance of SWE2110 Equipment
These systems together enable comprehensive pouch cell swelling characterization and allow researchers to measure pressure in pouch cell indirectly (via force/expansion under controlled gaps or pressures) and to monitor gas-driven volume growth directly.
2.2 Test Protocols
-
Conditioning: 25 °C rest for 5 min.
-
Charge: 1C constant current (CC) to 4.2 V, then CV to 0.025C; rest 5 min.
-
Discharge: 1C constant discharge (DC) to 2.8 V.
-
Swelling is monitored across two adjacent cycles to capture repeatability and irreversible drift.
2.3 Measurement Workflows
-
Cell volume test (GVM2200): measure initial mass (m₀), place cell in channel, set sampling and channel IDs in software; system logs real-time volume (or gas) change and synchronizes electrochemical data.
-
Cell thickness test (SWE2110): mount cell, define sampling frequency; system records thickness, Δthickness, voltage, current, temperature and capacity in real time.
-
How to measure pressure in pouch cell: use SWE2110 in constant gap or controlled-compression modes to measure expansion force (converted to pressure over known contact area). Alternatively, infer internal pressure changes by combining volume change (GVM) with mechanical stiffness models of the pouch package.
3. In-situ Analysis of Pouch Cell Swelling Behavior
3.1 Overall Pouch Cell Swelling Behavior During Full Charge-Discharge Cycles
Perform in-situ swelling analysis on the same cell’s two continuous charging and discharging processes.
The cell design information and capacity information are shown in Table 1.
Table 1. Cell design information and capacity information
|
Cell Design System :NCM811/Graphite Cell Size :47*35*4mm³ |
||||
|
Capacity/Ah |
CC | CV | DC | Coulombic Efficiency |
| 1st cycle | 0.5615 | 0.7001 | 0.6282 |
89.7% |
| 2nd cycle | 0.5231 | 0.6802 | 0.6064 |
89.1% |
Figure 4a shows cell volume vs. time and voltage, while Figure 4b shows thickness vs. time and voltage for the same cell during charge and discharge. Observations:
-
During CC charging, both volume and thickness increase.
-
During the CV stage, both metrics decrease slightly as concentration gradients relax.
-
During CC discharge, volume first rises then falls; thickness remains nearly constant initially then decreases.
-
Percentage changes in total volume and thickness are broadly consistent, indicating that thickness deformation largely drives the macroscopic volume change.
These synchronized signals demonstrate how pouch cell swelling is tied to electrochemical state: intercalation steps, phase transitions and thermal effects all produce measurable mechanical responses.
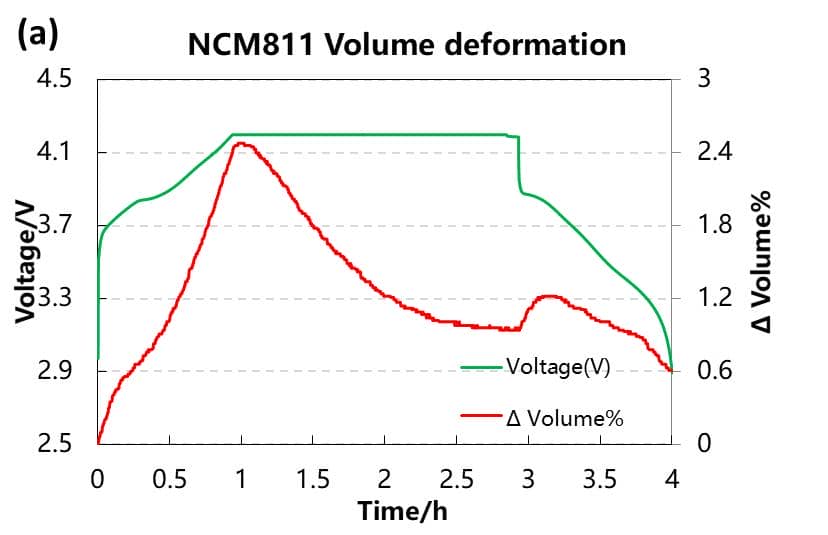
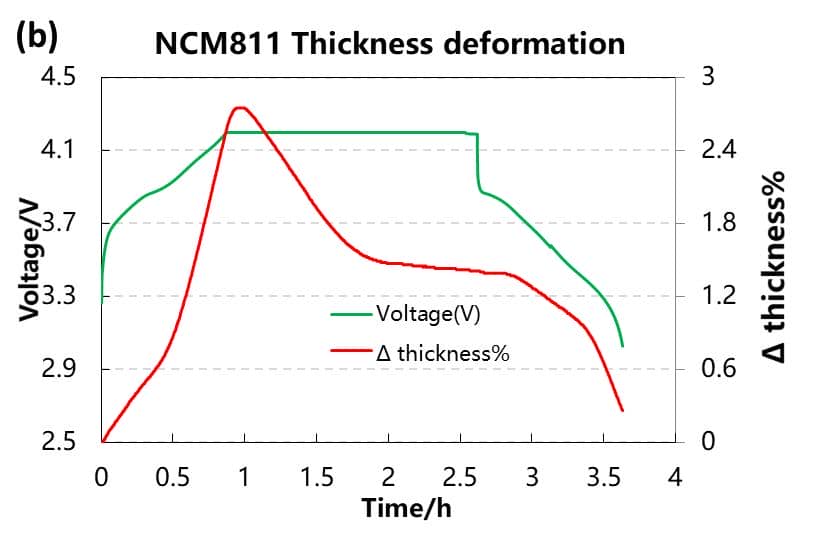
Figure 4. (a) Voltage and volume change during charge and discharge, showing characteristic pouch cell swelling. (b) Voltage and thickness change during charge and discharge.
3.2 Swelling During Constant Current Charging
Figure 5 (a) and (b) delve deeper by plotting the differential capacity (dQ/dV)—which identifies electrochemical phase transitions—against the swelling curves. The clear correlation is vital for understanding the root cause of pouch cell swelling. Each peak in the dQ/dV curve, signifying a phase change in the anode or cathode material, corresponds to a distinct change in the slope of the volume and thickness curves. This directly links mechanical expansion to electrochemical activity.
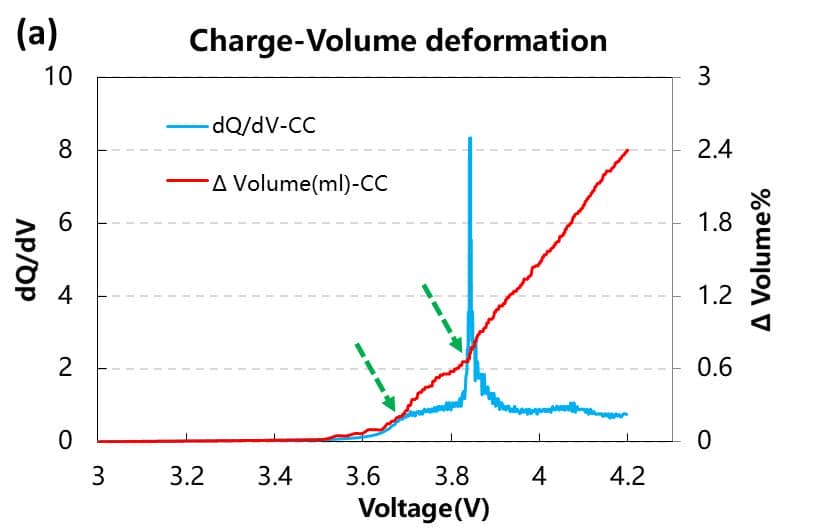
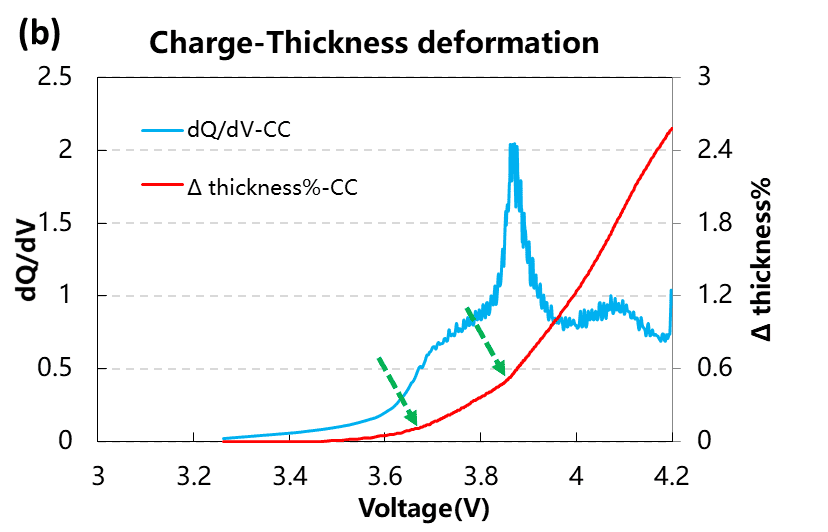
Figure 5. (a) Differential capacity and volume change during constant current charging. (b) Differential capacity and thickness change during constant current charging.
3.3 Cell Swelling Behavior During Constant Voltage Charging
During the CV hold phase (Figure 6 a & b), the current decreases exponentially. As the driving force for lithium intercalation decreases, the lithium concentration gradient within the graphite anode relaxes and becomes more uniform 5. This relaxation process is directly observable as a gradual decrease and stabilization of both volume and thickness, indicating a reduction in internal stress within the pouch cell.
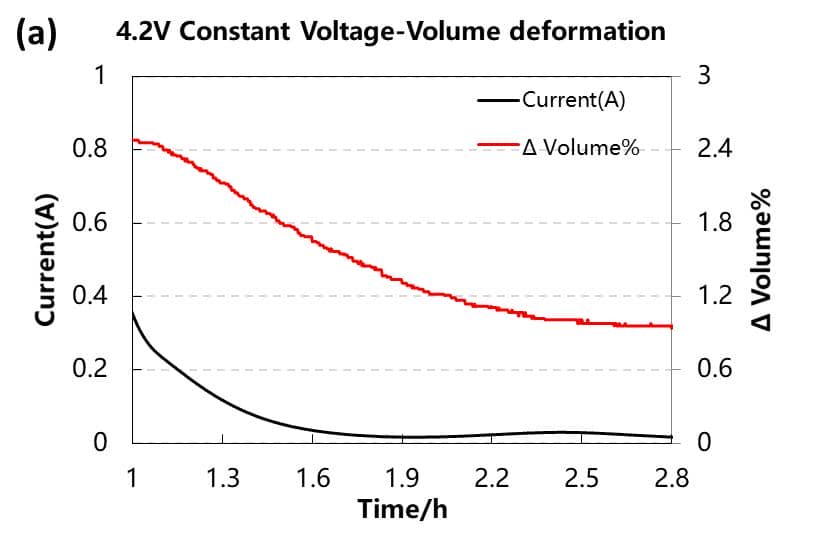
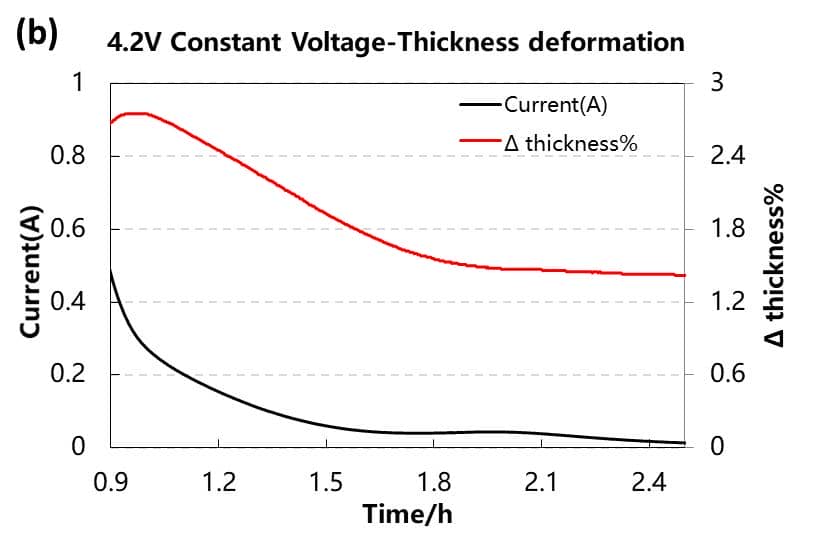
Figure 6. (a) Current and volume changes during constant voltage charging. (b) Current and thickness changes during constant voltage charging.
3.4 Asymmetric Swelling Behavior During Constant Current Discharge
The discharge process (Figure 7 a & b) reveals the non-equilibrium nature of pouch cell swelling. An initial volume expansion of ~0.3% is observed, potentially linked to a phase transition (Hexagonal 3→Hexagonal 2) in the NCM cathode material as lithium ions are re-inserted. Notably, this initial expansion is not clearly seen in the thickness data, highlighting the value of multi-dimensional analysis. Furthermore, the pouch cell swelling during charge and discharge is not perfectly symmetrical. This hysteresis is a key indicator of irreversible swelling, caused by incomplete structural recovery of the electrode materials 4, which accumulates over cycles and leads to performance degradation.
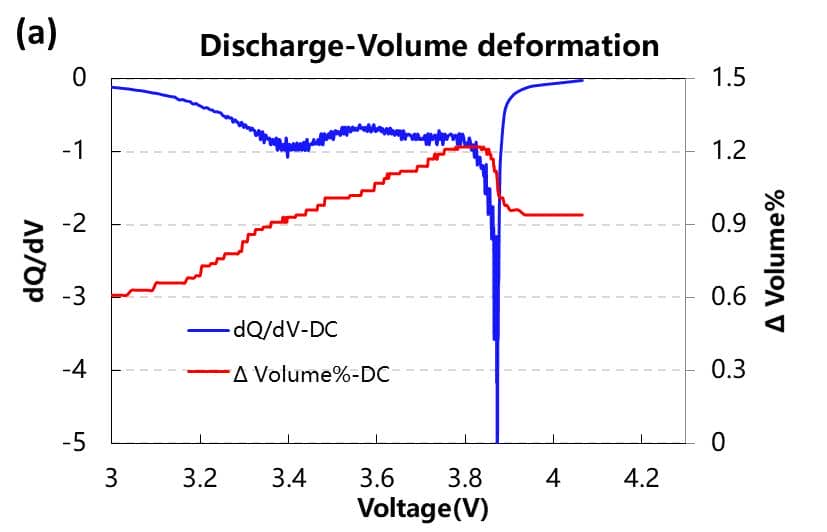
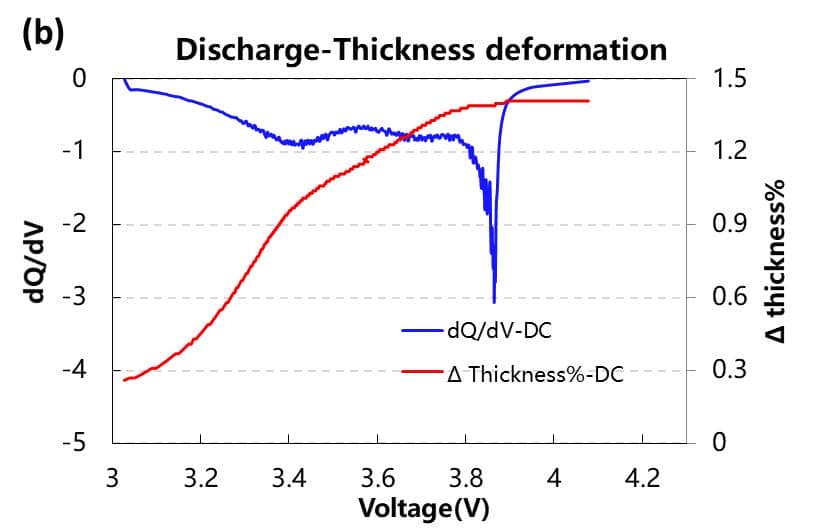
Figure 7. (a) Differential capacity and volume change during constant current discharge. (b) Differential capacity and thickness change during constant current discharge.
5. Summary
In this paper, an in-situ gas volume monitor (GVM) and an in-situ swelling analyzer (SWE) are used to analyze the volume and thickness swelling during the charging and discharging process of the pouch cell, which can characterize the reversible swelling and irreversible swelling in real time, and help developers from Analysis of pouch cell swelling behavior in different dimensions.
6. References
[1] Ruihe Li, Minggao Ouyang et al. Volume Deformation of Large-Format Lithium Ion Batteries under Different Degradation Paths. Journal of The Electrochemical Society, 2019, 166 (16) A4106-A4114
[2] Shiyao Zheng, Yong Yang et al. Correlation between long range and local structural changes in Ni-rich layered materials during charge and discharge process. J. Power Sources. 2019,412,336–343;
[3] Y. Reynier, R. Yazami, B. Fultz. The entropy and enthalpy of lithium intercalation into graphite. Journal of Power Sources .2003, 119–121 850–855
[4] Jan N. Reimers and J. R. Dahn. Electrochemical and In Situ X-Ray Diffraction Studies of Lithium Intercalation in LixCoO2. Journal of Electrochemical Society, 1992, 139, 8
[5] Haifeng Dai, Chenchen Yu, Xuezhe Wei, Zechang Sun. State of charge estimation for lithium-ion pouch batteries based on stress measurement. Energy, 2017,129, 16.
Contact Us
If you are interested in our products and want to know more details, please leave a message here, we will reply you as soon as we can.


