-
iestinstrument

Abstract
1. Background: Why Static EIS Falls Short
Traditional electrochemical impedance spectroscopy (EIS) is a powerful tool for deciphering battery mechanisms. However, its requirement for steady-state measurement conditions creates a fundamental disconnect from the dynamic conditions of real battery operation. This gap between “offline” characterization and “in-operation” reality prevents researchers from capturing the transient evolution of electrochemical reactions during actual charge and discharge processes.
Static EIS refers to impedance measurement performed after charging or discharging the battery to a specific state of charge (SOC) and allowing it to rest until electrochemical equilibrium is reached. While static EIS yields highly reproducible spectra under well-defined thermodynamic conditions, it measures the state after the process has stopped — not the dynamic behavior during the process. Transient failures, micro-crack formation, and short-lived impedance anomalies that occur under load are invisible to static EIS.
In contrast, Dynamic EIS (DEIS) introduces the AC perturbation concurrently with the ongoing charge or discharge process, enabling continuous impedance monitoring under realistic operating conditions. Dynamic EIS testing advances EIS from a post-hoc characterization step to an in-situ diagnostic tool.
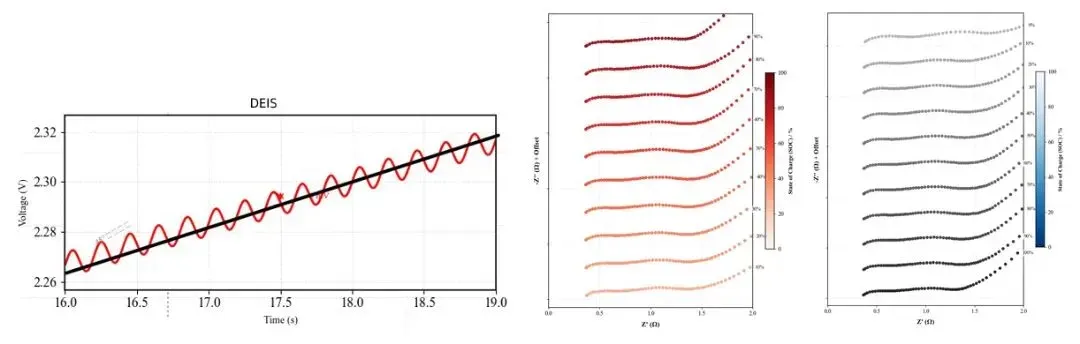
Figure 1. Schematic comparison of static EIS vs. dynamic EIS measurement principles
2. Principle
Dynamic EIS captures battery impedance by superimposing a small-amplitude AC perturbation onto the ongoing charge or discharge current, then measuring the amplitude ratio and phase shift between the response signal and the perturbation signal across a defined frequency range. Each frequency point probes a different internal physical or electrochemical process — from ohmic resistance at high frequencies to diffusion-limited responses at low frequencies — yielding a complete impedance spectrum as a “snapshot” of the cell’s internal state at that moment during cycling.
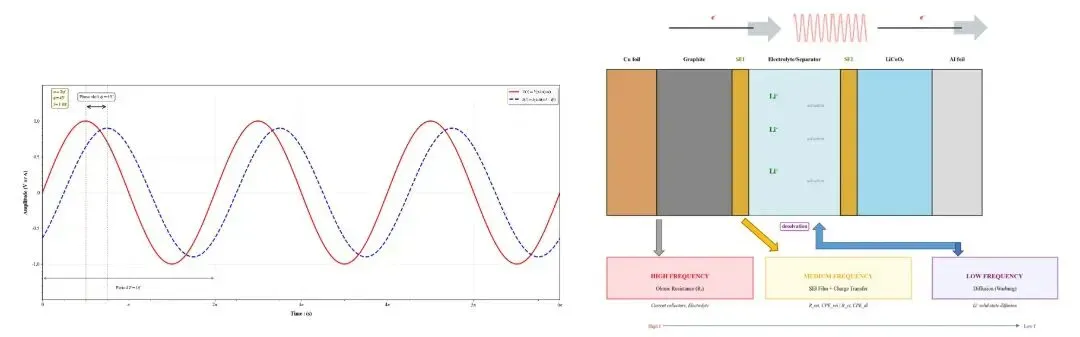
Figure 2. Dynamic EIS Signal During Battery Charging
2.1 Static EIS: Principles and Limitations
Static EIS is performed by first charging or discharging the battery to a specific SOC, allowing it to rest until equilibrium is reached, and then acquiring an impedance spectrum. Key characteristics:
-
Advantage: Yields highly reproducible spectra under well-defined, stable thermodynamic conditions, making static EIS suitable for precise mechanistic analysis and inter-laboratory comparison.
-
Fundamental limitation: Measures the cell state after the process has stopped, not the dynamic behavior during operation. Any transient phenomena — such as SEI micro-cracking under high-rate discharge — may self-heal during the rest period, making them invisible to the subsequent static EIS measurement.
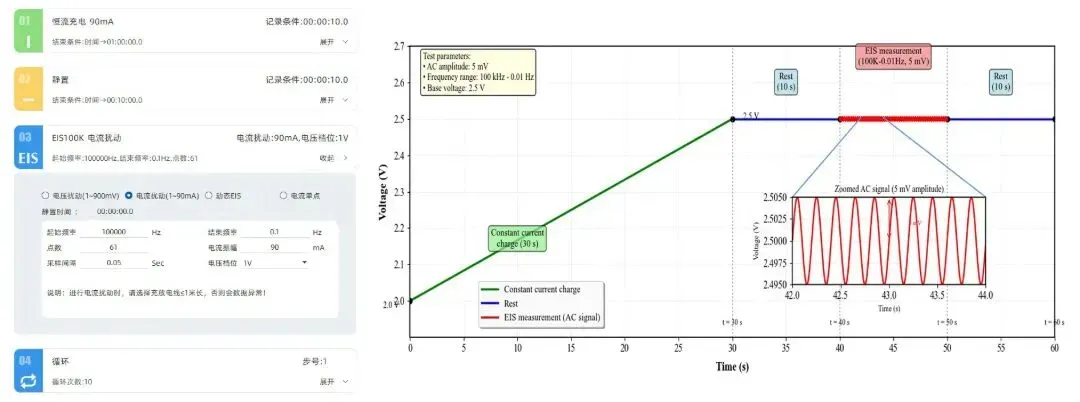
Figure 3. Timing diagram of synchronous charge/discharge and EIS acquisition for dynamic impedance monitoring
2.2 Dynamic EIS (DEIS): Continuous In-Situ Impedance Monitoring
Dynamic EIS introduces the AC perturbation concurrently with the ongoing charge or discharge process. This approach directly captures a continuous evolution of impedance spectra under realistic operating conditions — a sequence of time-resolved snapshots rather than a single static measurement. Key operational parameters:
-
Trigger modes: The AC signal can be triggered at specific voltage thresholds, time intervals, or applied continuously throughout the entire charge/discharge cycle.
-
Recommended frequency range: 100 kHz to 0.1 Hz (approximately 1 minute per full spectrum), providing a balance between measurement speed and frequency coverage.
-
Extended range (0.01 Hz): Extends acquisition time to approximately 15 minutes per spectrum — during which the cell’s SOC and potential will have shifted substantially, making the spectrum representative of a different electrochemical state.
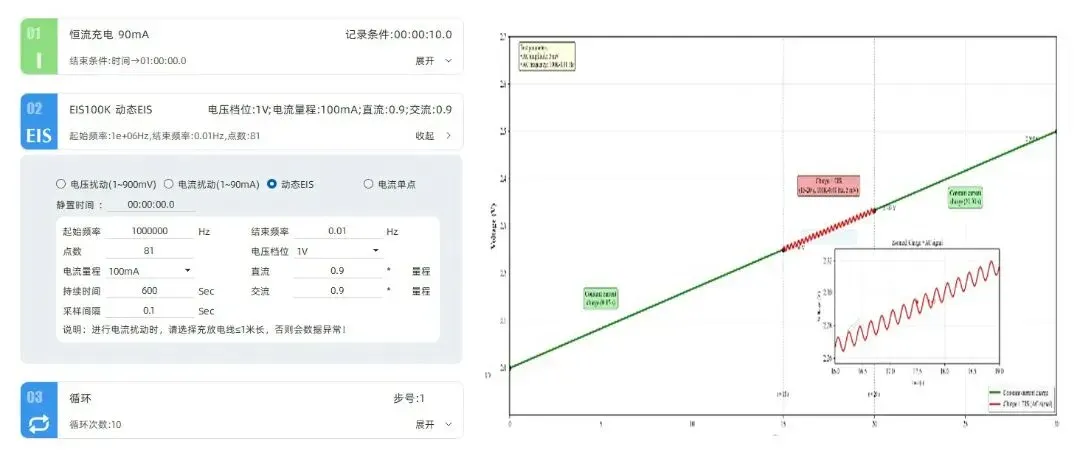
Figure 4. Dynamic EIS measurement sequence: constant-current charge step followed by an impedance scan from 100 kHz to 0.01 Hz
| Parameter | Static EIS | Dynamic EIS (DEIS) |
|---|---|---|
| Cell state during measurement | Electrochemical equilibrium (rest) | Active charge or discharge |
| Measurement trigger | After rest period | Voltage threshold / time interval / continuous |
| Frequency range (typical) | 100 kHz – 0.01 Hz | 100 kHz – 0.1 Hz (recommended) |
| Time per spectrum | Minutes to hours | ~1 min (100 kHz – 0.1 Hz) |
| Detects transient failure modes | No — may self-heal during rest | Yes — captured during dynamic event |
| Diffusion artifact risk | Low (equilibrium state) | Moderate (mitigated by high-frequency cutoff) |
| Suitable for aging studies | Yes (point-in-time) | Yes (cycle-by-cycle evolution) |
| Suitable for production QC | Slow — requires rest step | Fast — integrated into cycling protocol |
As cycling progresses, the charge‑transfer resistance (\( R_{\text{CT}} \)) gradually increases due to aging. DEIS captures this evolution in real time, revealing when and under what conditions the degradation begins. It also enables precise localization of the root cause—for instance, how impedance changes during high‑rate charge/discharge—a capability beyond the reach of static EIS.
Technical Note: Measurement Time and Artifact Control
Because the cell system is in a dynamic state during DEIS, the diffusion contribution is significantly affected by the applied current. Low-frequency measurements — especially with long acquisition times — can introduce inductive artifacts. To minimize such effects:
• Keep total acquisition time short: a frequency range of 100 kHz to 0.1 Hz (~1 minute per spectrum) is recommended.
• Extending down to 0.01 Hz takes approximately 15 minutes, during which the cell potential will have changed — making the resulting spectrum representative of a different electrochemical state rather than the target SOC.
3. Case Study 1: Tracking Impedance Evolution During Cycling Degradation
Dynamic EIS enables continuous, cycle-resolved monitoring of electrochemical degradation — capturing exactly when and how resistance components evolve during aging. DEIS was performed on a cell undergoing 50 cycles to monitor electrochemical impedance changes throughout the degradation process. Impedance spectra were extracted at cycles 20, 30, and 40, covering the 10–90% SOC range during both charge and discharge.
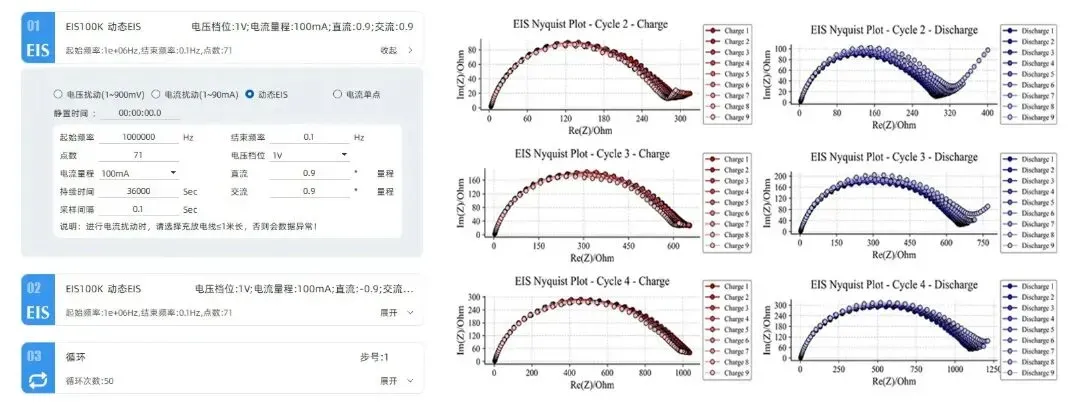
Figure 5. Dynamic EIS parameter configuration and representative Nyquist plots across cycles 20, 30, and 40 during charge and discharge
As cycling progresses, the charge-transfer resistance (\(R_{CT}\)) — the resistance associated with the faradaic charge-transfer reaction at the electrode-electrolyte interface — gradually increases due to aging-related interface degradation. DEIS captures this \(R_{CT}\) evolution in real time, revealing precisely when and under what operating conditions degradation begins. Dynamic EIS testing also enables precise localization of the root cause — for instance, identifying how impedance changes specifically during high-rate charge/discharge events — a diagnostic capability beyond the reach of static EIS, which can only provide a post-rest snapshot.
4. Case Study 2: Identifying Operational Failure Modes in Real Time
Dynamic EIS during active cycling exposes transient failure mechanisms that static EIS systematically misses — particularly SEI cracking and non-uniform formation that self-heal during conventional rest-based measurements. A batch of cells was tested at a 2C charge/discharge rate using DEIS to track impedance variations across the batch. Equivalent circuit model (ECM) fitting was applied to deconvolute the SEI resistance (RSEI) from the total impedance. The analysis precisely identified that uneven SEI formation — caused by:
-
Temperature gradients or pressure non-uniformity during the formation protocol
-
Variations in electrolyte filling volume and wetting time between cells
— was responsible for the observed inter-cell impedance differences. This distinction is only possible under dynamic conditions.
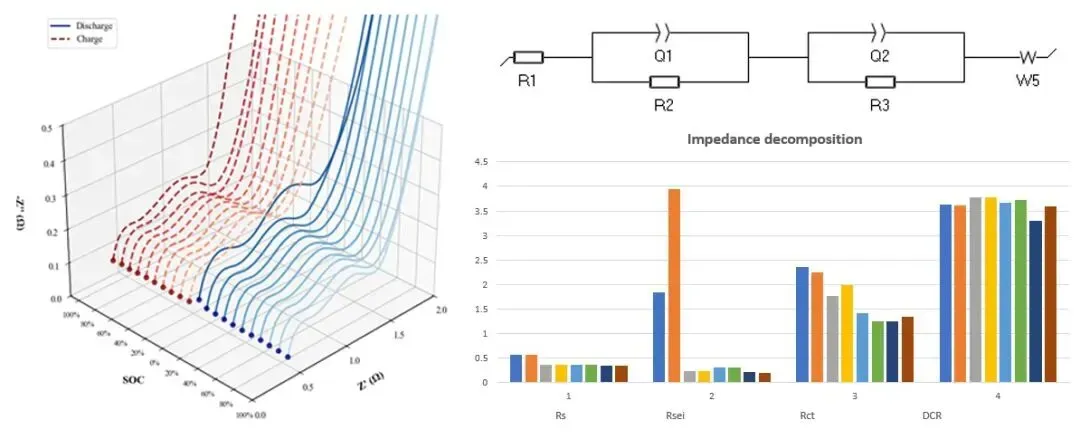
Figure 6. Tabulated impedance evolution data across multiple charge/discharge cycles during Dynamic EIS monitoring
A batch of cells was tested at a 2 C charge/discharge rate using DEIS to track impedance variations. Equivalent circuit model (ECM) fitting was applied to deconvolute the SEI resistance (\( R_{\text{SEI}} \)). The analysis precisely identified that uneven SEI formation—caused by temperature gradients or pressure non‑uniformity during formation, or by variations in electrolyte filling and wetting time—was responsible for the observed impedance differences.
During charge and discharge, the anode (graphite or silicon‑based) undergoes rapid, non‑uniform volume expansion and contraction. The rate of volume change increases with higher C‑rates, leading to larger local strain gradients. If the SEI layer lacks sufficient flexibility or adhesion, these dynamic strains can induce localized micro‑cracking or delamination.
With static EIS, the cell would first be discharged and rested. By the time the measurement begins, the anode volume would have recovered, and any micro‑cracks would have been promptly re‑wetted by electrolyte, potentially self‑healing. The impedance would then return to a “normal” value, masking the underlying issue. DEIS, by contrast, detects the anomaly during the dynamic event, revealing the transient failure that static methods miss.
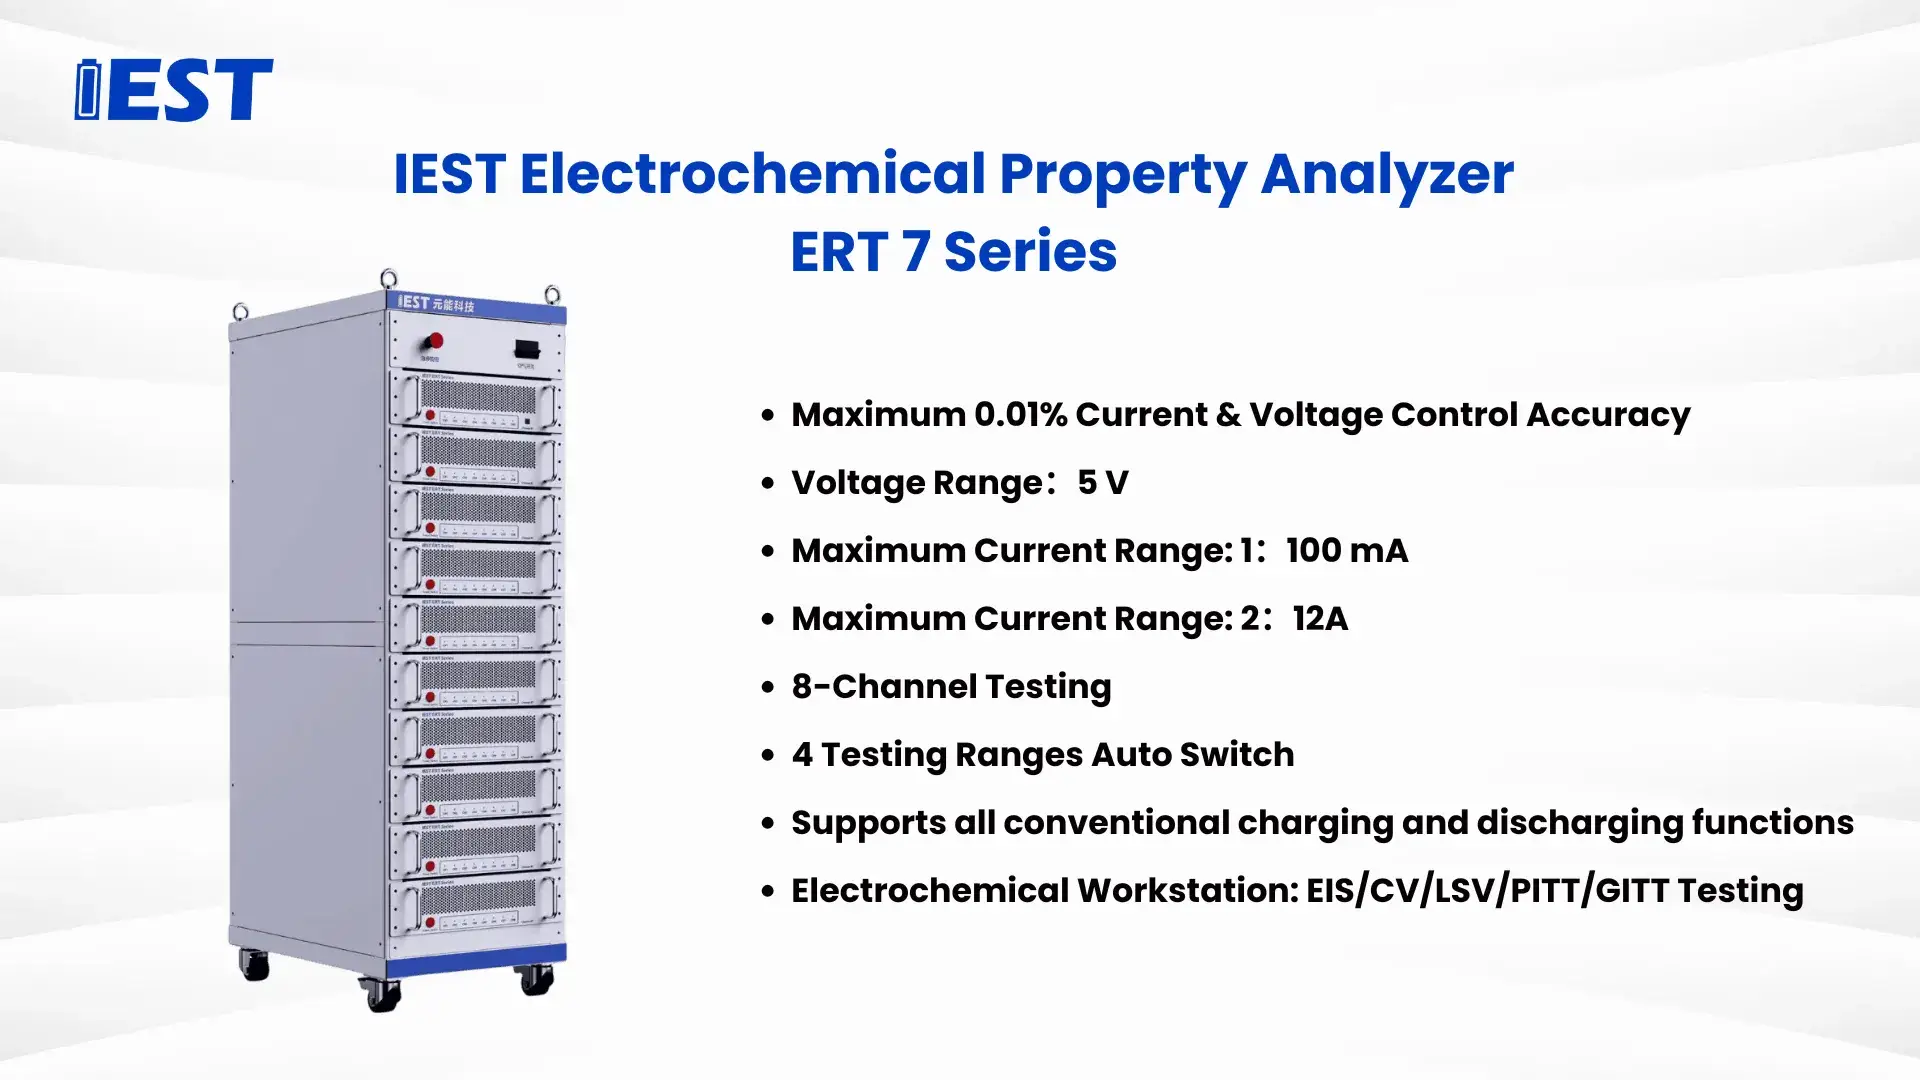
🔬 IEST ERT7008 Electrochemical Performance Analyzer
Conventional cell testing often requires lengthy cycling protocols, and neither a handheld internal resistance meter nor traditional static EIS can probe a cell’s internal mechanisms under actual operating conditions. The IEST ERT7008 overcomes this limitation with integrated DEIS capability, enabling researchers to investigate internal mechanistic changes in real-world usage scenarios.
- Frequency range: 100 kHz to 0.01 Hz — full DEIS spectrum in ~1 minute at the recommended 0.1 Hz cutoff
- AC trigger modes: Voltage threshold, fixed time interval, or continuous throughout cycling
- ECM fitting integration: Deconvolutes RCT, RSEI, and diffusion elements from a single DEIS spectrum
- Synchronized cycling + impedance: No interruption to the charge/discharge protocol
5. FAQs
5.1 What is dynamic EIS (DEIS) and how does it differ from static EIS in battery testing?
Dynamic EIS (DEIS) is an electrochemical impedance measurement technique that superimposes a small-amplitude AC perturbation onto an ongoing charge or discharge current, capturing impedance spectra in real time without interrupting the cycling process. Static EIS, by contrast, requires the battery to be at electrochemical equilibrium — it measures the cell state after charging or discharging has stopped and a rest period has elapsed. The critical difference is that static EIS cannot detect transient failure modes (such as SEI micro-cracking under high C-rates) because these phenomena may self-heal during the mandatory rest period before measurement begins; dynamic EIS captures them as they occur.
5.2 What frequency range should be used for dynamic EIS battery measurements?
For dynamic EIS battery measurements, a frequency range of 100 kHz to 0.1 Hz is recommended. At this range, a complete impedance spectrum is acquired in approximately one minute — short enough that the cell’s SOC and potential remain effectively constant during acquisition. Extending the lower frequency limit to 0.01 Hz increases acquisition time to approximately 15 minutes per spectrum; over this duration, the cell potential shifts significantly, meaning the resulting spectrum no longer represents a single well-defined electrochemical state. At frequencies below 0.1 Hz, inductive artifacts from the dynamic operating current also become more pronounced.
5.3 How does dynamic EIS measure charge-transfer resistance (R_CT) evolution during aging?
Charge-transfer resistance (RCT) refers to the impedance contribution from the faradaic charge-transfer reaction at the electrode-electrolyte interface, typically represented as a semicircle in the mid-frequency region of a Nyquist plot. During dynamic EIS monitoring over 50 charge/discharge cycles, RCT increases progressively as aging-related interface degradation accumulates. Because DEIS records a full impedance spectrum at each defined SOC point during every cycle, it builds a cycle-resolved RCT evolution map — revealing precisely when degradation onset occurs and at which SOC range it is most pronounced. This time-resolved resolution is unavailable from static EIS, which provides only a single post-rest data point per measurement session.
5.4 Can dynamic EIS detect non-uniform SEI formation in battery cells?
Yes. Dynamic EIS can identify non-uniform SEI formation by tracking SEI resistance (RSEI) separately from charge-transfer resistance through equivalent circuit model (ECM) fitting applied to DEIS spectra collected during 2C cycling. In the case study in this article, DEIS testing across a cell batch at 2C revealed inter-cell RSEI differences attributable to temperature gradients, pressure non-uniformity during formation, and variations in electrolyte filling and wetting time. Static EIS would miss these differences because the rest period allows micro-cracks in non-uniform SEI regions to be re-wetted by electrolyte before measurement begins — masking the underlying formation quality issue.
5.5 What equipment is used for dynamic EIS testing in lithium-ion battery research?
Dynamic EIS testing requires an electrochemical analyzer that can superimpose AC perturbation signals onto an ongoing DC charge or discharge current, then synchronously record and resolve the impedance response across a wide frequency range — without interrupting the cycling protocol. The IEST ERT7008 Electrochemical Performance Analyzer integrates DEIS capability with a synchronized cycling channel, supporting frequency ranges from 100 kHz to 0.01 Hz, multiple AC trigger modes (voltage threshold, time interval, or continuous), and built-in ECM fitting for real-time deconvolution of RCT and RSEI from each impedance spectrum.
