-
iestinstrument

Abstract
Dynamic EIS (DEIS)—also called dynamic electrochemical impedance spectroscopy—measures a lithium battery’s full impedance spectrum continuously during charging or discharging, without requiring any rest period. By capturing transient electrochemical processes invisible to conventional static EIS, dynamic EIS testing enables real-time battery diagnostics including early fault detection, lithium plating identification, and state-of-charge estimation under actual operating conditions.
1. Introduction
Electrochemical Impedance Spectroscopy (EIS) is a fundamental technique for investigating electrochemical interfaces and is extensively used to analyze processes within lithium-ion batteries. The method treats the battery as a “black box,” applying a sinusoidal AC signal across a spectrum of frequencies and measuring the resulting electrical response. By interpreting the frequency-dependent feedback in the EIS spectrum, it becomes possible to diagnose irregularities in the battery’s internal electrochemical behavior.
Conventional static EIS testing must meet three key requirements: causality, linearity, and stability. Measurements are therefore performed after the cell has reached electrochemical equilibrium through prolonged rest — typically 30 minutes to several hours — before a valid spectrum can be acquired. That constraint, however, misses fast, transient phenomena that occur during real operation. Dynamic EIS (DEIS) — formally defined as an impedance measurement method that acquires full EIS spectra continuously while the battery carries an applied charge or discharge current, eliminating any equilibration requirement — overcomes that limitation, enabling actionable EIS diagnostic testing in non-steady-state conditions.
2. Significance of Dynamic EIS Testing
Dynamic EIS testing enables continuous impedance acquisition during battery operation, delivering diagnostic capabilities that static EIS cannot provide. Its significance lies primarily in the following aspects.
2.1 Real-Time Monitoring and Capturing Dynamic Processes
Dynamic EIS reflects the instantaneous electrochemical state of a battery in real time. For instance, dynamic EIS testing can capture the rapid growth process of lithium dendrites or fast electrochemical reactions during fast charging. If one waits for a long rest period before conducting EIS testing, lithium plating behavior may gradually weaken or even disappear. Dynamic EIS therefore possesses a unique advantage in capturing rapid electrochemical reaction behaviors that static EIS systematically misses.
2.2 Analysis of Non-Linear and Non-Steady-State Processes
Dynamic EIS enables impedance characterization under non-linear and non-steady-state conditions that conventional static EIS cannot access. Actual battery systems in practical use operate under non-steady-state conditions, constantly subject to disturbances like temperature fluctuations and load variations. Dynamic EIS testing acquires impedance information across these different states, providing comprehensive data support for battery performance evaluation and fault diagnosis.
2.3 Early Fault Diagnosis and Advantages for Data Modeling
Since Dynamic EIS eliminates the need for lengthy rest periods, it enables earlier detection of potential battery faults. When lithium plating or abnormal thermal runaway occurs internally, the mid-frequency impedance measured by Dynamic EIS may decrease or increase abnormally, providing battery management systems with timely warning signals based on mid-frequency impedance deviations. Furthermore, DEIS measurement data volume is typically much larger than static EIS. DEIS measurement data can be used to establish more accurate electrochemical battery models, providing more reliable support for battery performance prediction, lifetime assessment, and optimized design.
| Feature | Static EIS | Dynamic EIS (DEIS) |
|---|---|---|
| Measurement condition | Electrochemical equilibrium (rest) |
Active charge / discharge |
| Equilibration time required | 30 min – several hours | None |
| Captures transient processes | No | Yes |
| Lithium plating detection | Limited | Yes (mid-freq. \(R_{ct}\) shift) |
| SOC correlation via Rct | Not reliable | Yes (strong correlation, 0–70% SOC) |
| Data volume per cycle | Low | High (continuous spectra) |
| BMS / on-board integration | Not feasible | Feasible with embedded impedance analyzer |
| Requires external amplifier (large cells) | Often yes | No (IEST BIT6000 built-in) |
3. Innovative Solution: IEST Battery Impedance Tester (BIT6000)
The IEST BIT6000 Battery Impedance Tester can be seamlessly integrated with third-party charging equipment to enable Dynamic EIS testing during battery operation. Its software supports continuous testing modes, allowing real-time impedance monitoring under non-steady-state conditions. A major advantage of the BIT6000 is its ability to perform EIS diagnostic testing on high-capacity, low-impedance cells — such as power or energy storage batteries — without an external current amplifier, effectively overcoming a key industry bottleneck for large-format cell characterization.
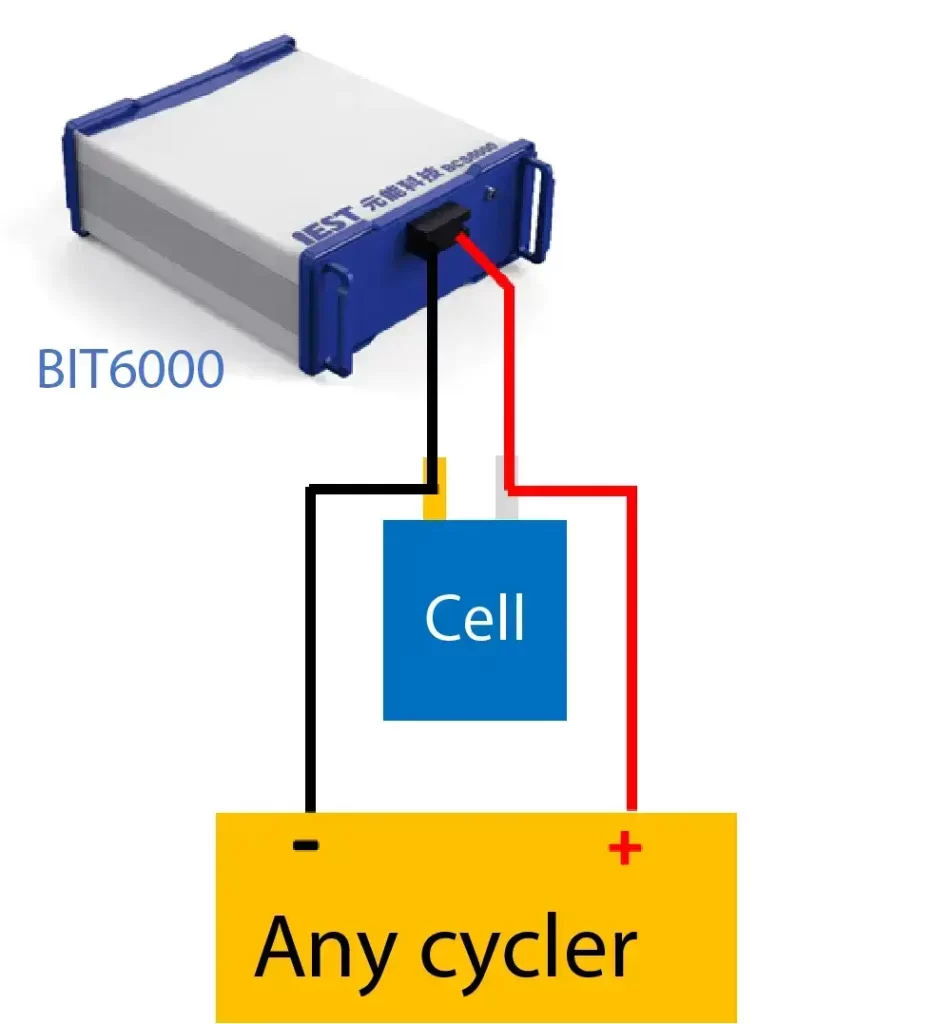
Figure 1. IEST BIT6000 Integrated with Third-Party Charger/Discharger for Dynamic EIS (DEIS) Testing
4. Continuous Dynamic EIS Monitoring During Charging
A continuous DEIS measurement on a 40 Ah LFP power battery (LFP//C) demonstrates how dynamic impedance data tracks electrochemical changes across the full charging cycle. State of Charge (SOC) refers to the remaining usable capacity of a battery expressed as a percentage of its rated capacity, where 0% represents fully discharged and 100% represents fully charged. Under a constant current (CC) charging condition of 0.3C — a standard dynamic current profile for DEIS validation that can be extended to variable current profiles representative of real-world load scenarios — DEIS testing was performed continuously while charging until the battery reached approximately 70% SOC. These test results were further analyzed using established electrochemical equivalent circuit models to obtain the evolution of dynamic parameters (including resistance and capacitive reactance corresponding to electrochemical processes with different time constants) as the cell charged to different SOC levels.
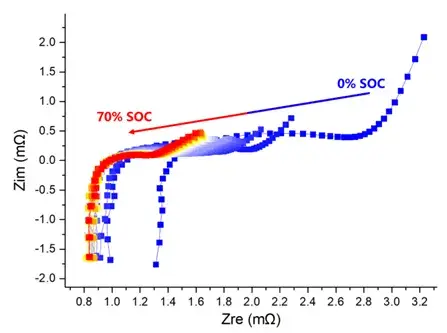
Figure 2. Continuous Dynamic EIS Monitoring of a 40 Ah LFP Battery under 0.3C Constant Current Charging
Figure 3(a) illustrates the micro-model proposed by Barsoukov et al. [1] for the intercalation and deintercalation processes of lithium ions within the electrode active material. Figure 3(b) shows the typical EIS spectrum for these processes. Conventional EIS test results generally encompass five electrochemical processes with distinct time constants [1, 2]:
| Frequency Region | Frequency Range | Electrochemical Process | Equivalent Circuit Element |
|---|---|---|---|
| Ultra-High | > 10 kHz | Ohmic resistance (electrolyte, separator, current collectors) | \(R_s\) |
| High | 1 – 10 kHz | Li-ion diffusion through SEI film | \(R_{SEI} \parallel C_{SEI}\) |
| Mid | 10 Hz – 1 kHz | Charge transfer at electrode–electrolyte interface | \(R_{ct} \parallel C_{dl}\) |
| Low | 0.01 – 10 Hz | Solid-state Li-ion diffusion within active material particles | \(Z_W\) (Warburg, 45° slope) |
| Very Low | < 0.01 Hz | Crystal structure change / new phase formation / ion accumulation | Semicircle + near-vertical line |
4.1 Ultra-High Frequency Region:
The ohmic resistance Rs is associated with lithium-ion and electron transport through the electrolyte, porous separator, and current collectors. This appears as a single point intersecting the real axis (Z’) on the EIS plot.
4.2 High Frequency Region:
A semicircle related to lithium-ion diffusion through the Solid Electrolyte Interphase (SEI) film. The SEI film is a passivation layer formed on the electrode surface during initial cycling, composed of electrolyte decomposition products; its ionic conductivity directly influences high-frequency impedance. This process is represented by \(R_{SEI} // C_{SEI}\) in the equivalent circuit.
4.3 Mid-Frequency Region:
A semicircle corresponding to the charge transfer process at the electrode–electrolyte interface. Charge transfer resistance (\(R_{ct}\)) is defined as the resistance to faradaic electron transfer across this interface; \(R_{ct}\) is temperature- and SOC-dependent and serves as the primary diagnostic parameter in dynamic EIS analysis. This process is represented by \(R_{ct} \parallel C_{dl}\).
4.4 Low Frequency Region:
Related to solid-state diffusion of lithium ions within active material particles. This appears as a straight line with a 45° slope on the EIS plot, represented by Warburg impedance \(Z_W\) in the equivalent circuit.
4.5 Very Low Frequency Region (<0.01 Hz):
Comprises a semicircle potentially related to changes in active material particle crystal structure or new phase formation, and a near-vertical line related to lithium-ion accumulation/depletion. Lithium batteries are typically not analyzed at such low frequencies; the common equivalent circuit therefore uses the \(R_s – (R_{SEI} \parallel C_{SEI}) – (R_{ct} \parallel C_{dl}) – Z_W\) model shown in Figure 4(a).
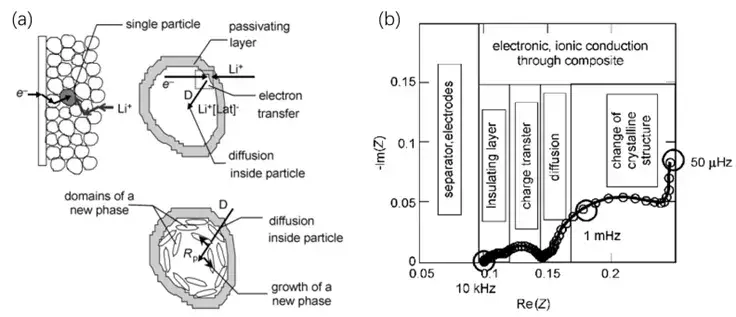
Figure 3. (a) Micro-model for Li-ion intercalation/deintercalation in electrode active materials (Barsoukov et al.); (b) Typical EIS spectrum showing five frequency-dependent processes.
Figure 4(b) shows the variation of dynamic \(R_{ct}\) with SOC obtained by fitting continuous DEIS results using the equivalent circuit. Within the 0\% to 70\% SOC range, dynamic \(R_{ct}\) first decreases rapidly (0\%–30\% SOC) and then decreases more slowly (30\%–70\% SOC). LFP EIS analysis reveals a practical advantage here: for LFP batteries, due to their relatively flat charge/discharge voltage plateau, OCV-based SOC estimation in practical applications results in significantly larger errors compared to other cell chemistries [3]. DEIS analysis, however, demonstrates that dynamic \(R_{ct}\) exhibits a strong, monotonic correlation with SOC across the 0\%–70\% range, making it a reliable parameter for LFP SOC estimation — a finding with direct relevance for battery management system (BMS) design.
| SOC Range | Dynamic Rct Trend | Rate of Change | Diagnostic Significance |
|---|---|---|---|
| 0% – 30% | Rapid decrease | Fast | Li-ion intercalation kinetics improving as lattice sites open; sensitive window for plating detection |
| 30% – 70% | Slow decrease | Moderate | Plateau-phase kinetics stabilization; \(R_{ct}\) still monotonically linked to \(SOC\) — usable for BMS estimation. |
| OCV (static) |
Nearly flat | Near zero | LFP voltage plateau too flat for reliable SOC estimation — DEIS Rct superior in this regime |
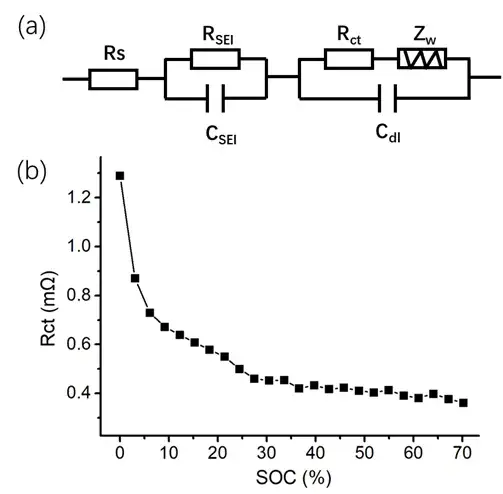
Figure 4. (a) Common equivalent circuit model for lithium batteries; (b) Dynamic Rct vs. SOC from continuous DEIS testing of a 40 Ah LFP power battery.
5. Summary
The IEST BIT6000 Battery Impedance Tester enables continuous Dynamic EIS testing on large-format, low-impedance cells when integrated with standard charging equipment — without requiring an external current amplifier. The BIT6000 provides valuable insights into transient electrochemical behaviors, supporting advanced research into battery kinetics under realistic operating conditions. In a case study with a 40 Ah LFP cell, dynamic Rct showed a clear, monotonic SOC-dependent correlation across the 0%–70% SOC range, highlighting the potential of EIS diagnostic testing and LFP EIS analysis for improved state estimation and next-generation battery management.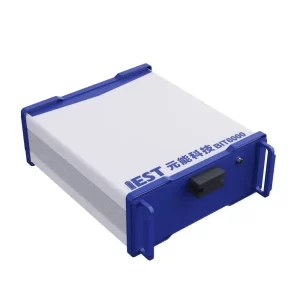
Figure 5. Appearance of the IEST BIT6000 Battery Impedance Tester
6. References
[1] E. Barsokov, D.H. kim, H.-S. Lee, H. Lee, M. Yakovleva, Y. Gao and J.F. Engel, Comparison of kinetic properties of LiCoO2 and LiTi0.05Mg0.05Ni0.7Co0.2O2 by impedance spectroscopy. Solid State Ionics 161 (2003) 19-29.
[2] E. Barsoukov and J.R. Macdonald. Impedance spectroscopy theory, experiment, and applications. Second Edition. New Jersey: John Wiley & Sons, Inc., Hoboken, 2005.
[3] P.P. Xu, J.Q. Li, Q. Xue and F.C. Sun. A syncretic state-of-charge estimator for LiFePO4 batteries leveraging expansion force. J Energy Storage 50 (2022) 104559.
7. FAQs
7.1 What is dynamic EIS (DEIS) testing in lithium batteries?
Dynamic EIS (DEIS), or dynamic electrochemical impedance spectroscopy, measures a battery’s full impedance spectrum continuously during charging or discharging — without requiring a prior rest period. DEIS captures transient electrochemical processes such as charge transfer resistance changes, SEI film evolution, and lithium plating events that static EIS measurements at equilibrium cannot detect.
7.2 What is the difference between static EIS and dynamic EIS?
Static EIS requires 30 minutes to several hours of battery rest to reach electrochemical equilibrium before measurement, limiting analysis to steady-state conditions only. Dynamic EIS (DEIS) measures impedance continuously during active charge or discharge cycles, making dynamic EIS testing suited for real-time fault diagnosis, non-steady-state characterization, and transient process capture — including lithium plating and thermal runaway precursors — under actual operating conditions.
7.3 Can dynamic EIS be used to estimate SOC in LFP batteries?
Yes. LFP EIS analysis using DEIS shows that charge transfer resistance (Rct) correlates strongly and monotonically with SOC across the 0%–70% range, even though the flat LFP voltage plateau makes conventional OCV-based SOC estimation unreliable. The IEST BIT6000 Battery Impedance Tester performs continuous DEIS measurement on large-format LFP cells without an external amplifier, providing the high-resolution impedance data required for dynamic Rct-based SOC tracking in BMS applications.
7.4 What electrochemical processes can dynamic EIS detect in a lithium battery?
Dynamic EIS resolves five frequency-dependent processes: ohmic resistance (Rs) at ultra-high frequencies, SEI film resistance (RSEI) at high frequencies, charge transfer resistance (Rct) at mid-frequencies, solid-state lithium-ion diffusion (Warburg impedance ZW) at low frequencies, and phase-change or ion accumulation effects below 0.01 Hz. Mid-frequency Rct deviations are especially diagnostic for detecting lithium plating and early thermal runaway precursors in real time.
7.5 What equipment is required for dynamic EIS testing on large-format battery cells?
Dynamic EIS testing on large-format, high-capacity cells requires an impedance analyzer capable of injecting small-amplitude AC signals while the cell carries a high DC charge/discharge current. Standard potentiostats typically require an external current booster for such cells. The IEST BIT6000 addresses this directly by integrating with third-party charge/discharge equipment and performing full-spectrum EIS diagnostic testing on power and energy storage cells without an external amplifier — covering high-capacity, low-impedance cell formats.
