

In lithium battery electrodes, conductive additives and binder are mixed to form a continuous carbon-binder domain (CBD), with active material particles embedded within this network. The CBD serves as the primary pathway for electron and ion transport. Conductive additives establish an interconnected three-dimensional network to conduct electrons, similar to a neural network; the CBD also contains submicron- and nano-scale pores filled with electrolyte, facilitating lithium-ion diffusion, similar to capillaries. Conductive additives act as the “bridge” connecting active material particles, reducing resistance and improving rate capability. Different conductive additives create distinct pore microstructures that influence ion diffusion, and this “bridge” is not always better with higher content — insufficient additive leaves electron pathways broken, while excessive additive causes slurry dispersion issues, process instability, and higher cost.
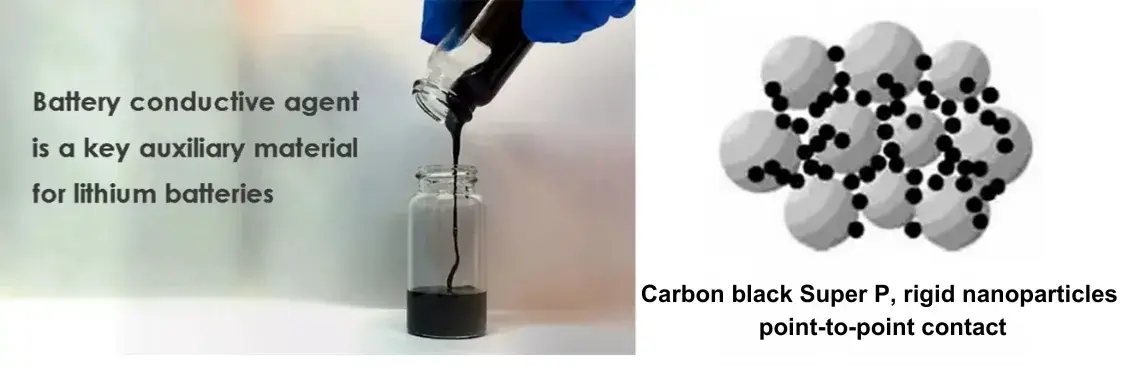
Figure 1. Conductive additives as critical auxiliary materials in lithium battery electrodes, forming the carbon-binder domain (CBD) network.
The distribution state of conductive additive in the electrode is influenced not only by additive type and morphology but also by processing conditions — whether slurry dispersion achieves uniform additive distribution, whether the drying process avoids stratification, and whether calendering facilitates interconnected conductive pathways. Electrode design and manufacturing is therefore a multi-variable undertaking, and a classic industry challenge is determining the conductive additive content “sweet spot” that balances battery performance, processing stability, and cost. Insufficient additive results in high electrode resistance, which can cause excessive heating and capacity fade during fast charging; excessive additive increases slurry viscosity, leading to coating defects such as cracking and powder shedding, while also raising cost per ton of slurry, since conductive additives such as conductive carbon black and carbon nanotubes are expensive materials. To address these issues, we designed a gradient experiment and performed quantitative analyses to provide a scientific basis for additive incorporation.
Variables were strictly controlled. The composition (and ratio) of materials was fixed—using a cathode active material (LCO), binder (PVDF), and solvent (NMP)—with only the conductive additive (SP) content varied. Five gradients were set at 0.5%, 1.0%, 1.3%, 1.5%, and 1.8%, while maintaining consistent processing conditions.
A combination of the IEST BSR series for slurry resistance measurements and the IEST BER series for electrode resistance measurements was used to analyze samples with different conductive additive contents.
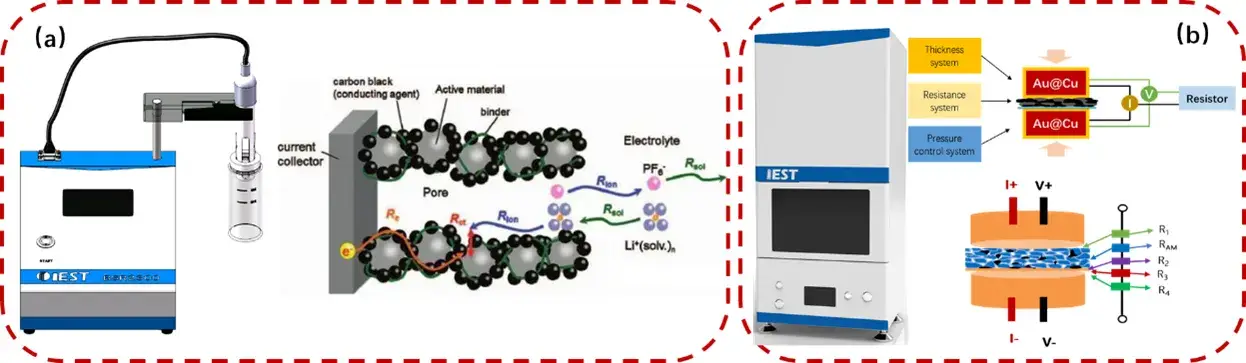
Figure 2. Schematic of the Slurry Resistance Tester (BSR Series) and Electrode Resistance Testing Equipment (BER Series)
The ideal distribution state for conductive additive in the slurry is one in which particles are uniformly dispersed and interact strongly with the active material — forming a coating structure — while also establishing an interconnected network among themselves, a state that must be maintained through subsequent processing. Figure 3 shows how slurry resistivity varies with increasing conductive additive content. As conductive additive content increases from 0.5% to 1.5%, slurry resistivity shows a steep decline, driven mainly by the gradual formation of a continuous conductive network that provides an efficient electron transport pathway. When additive content exceeds 1.5%, however, resistivity levels off, and a slight increase in resistivity is observed from 1.5% to 1.8%. This is likely due to localized agglomeration — “islands” of conductive additive — which impedes electron transfer between active material particles. This demonstrates that conductive additive effectiveness has a distinct saturation point, beyond which further additions bring negligible benefit and can even be counterproductive due to dispersion issues.
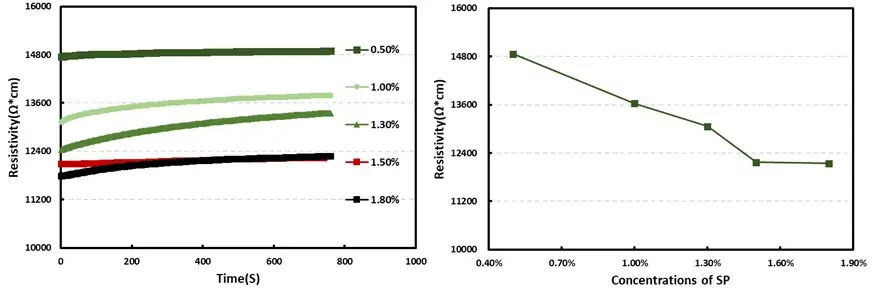
Figure 3. Variation in slurry resistivity with increasing conductive additive content (0.5%–1.8%), measured by IEST BSR series.
Beyond resistivity, conductive additive content also significantly affects slurry processability and production cost. Excessive additive increases viscosity, which can cause poor leveling during coating and uneven electrode thickness — manifesting as a “fish-scale” defect on the electrode surface that directly affects capacity uniformity.
Electrode-level resistance is of greater concern than slurry-level resistivity alone, and correlating slurry resistance with electrode resistance can help identify abnormal process stages early, preventing wasted time and resources. For each conductive additive content level, electrode resistivity was measured at six different positions to calculate mean resistivity and coefficient of variation (COV).
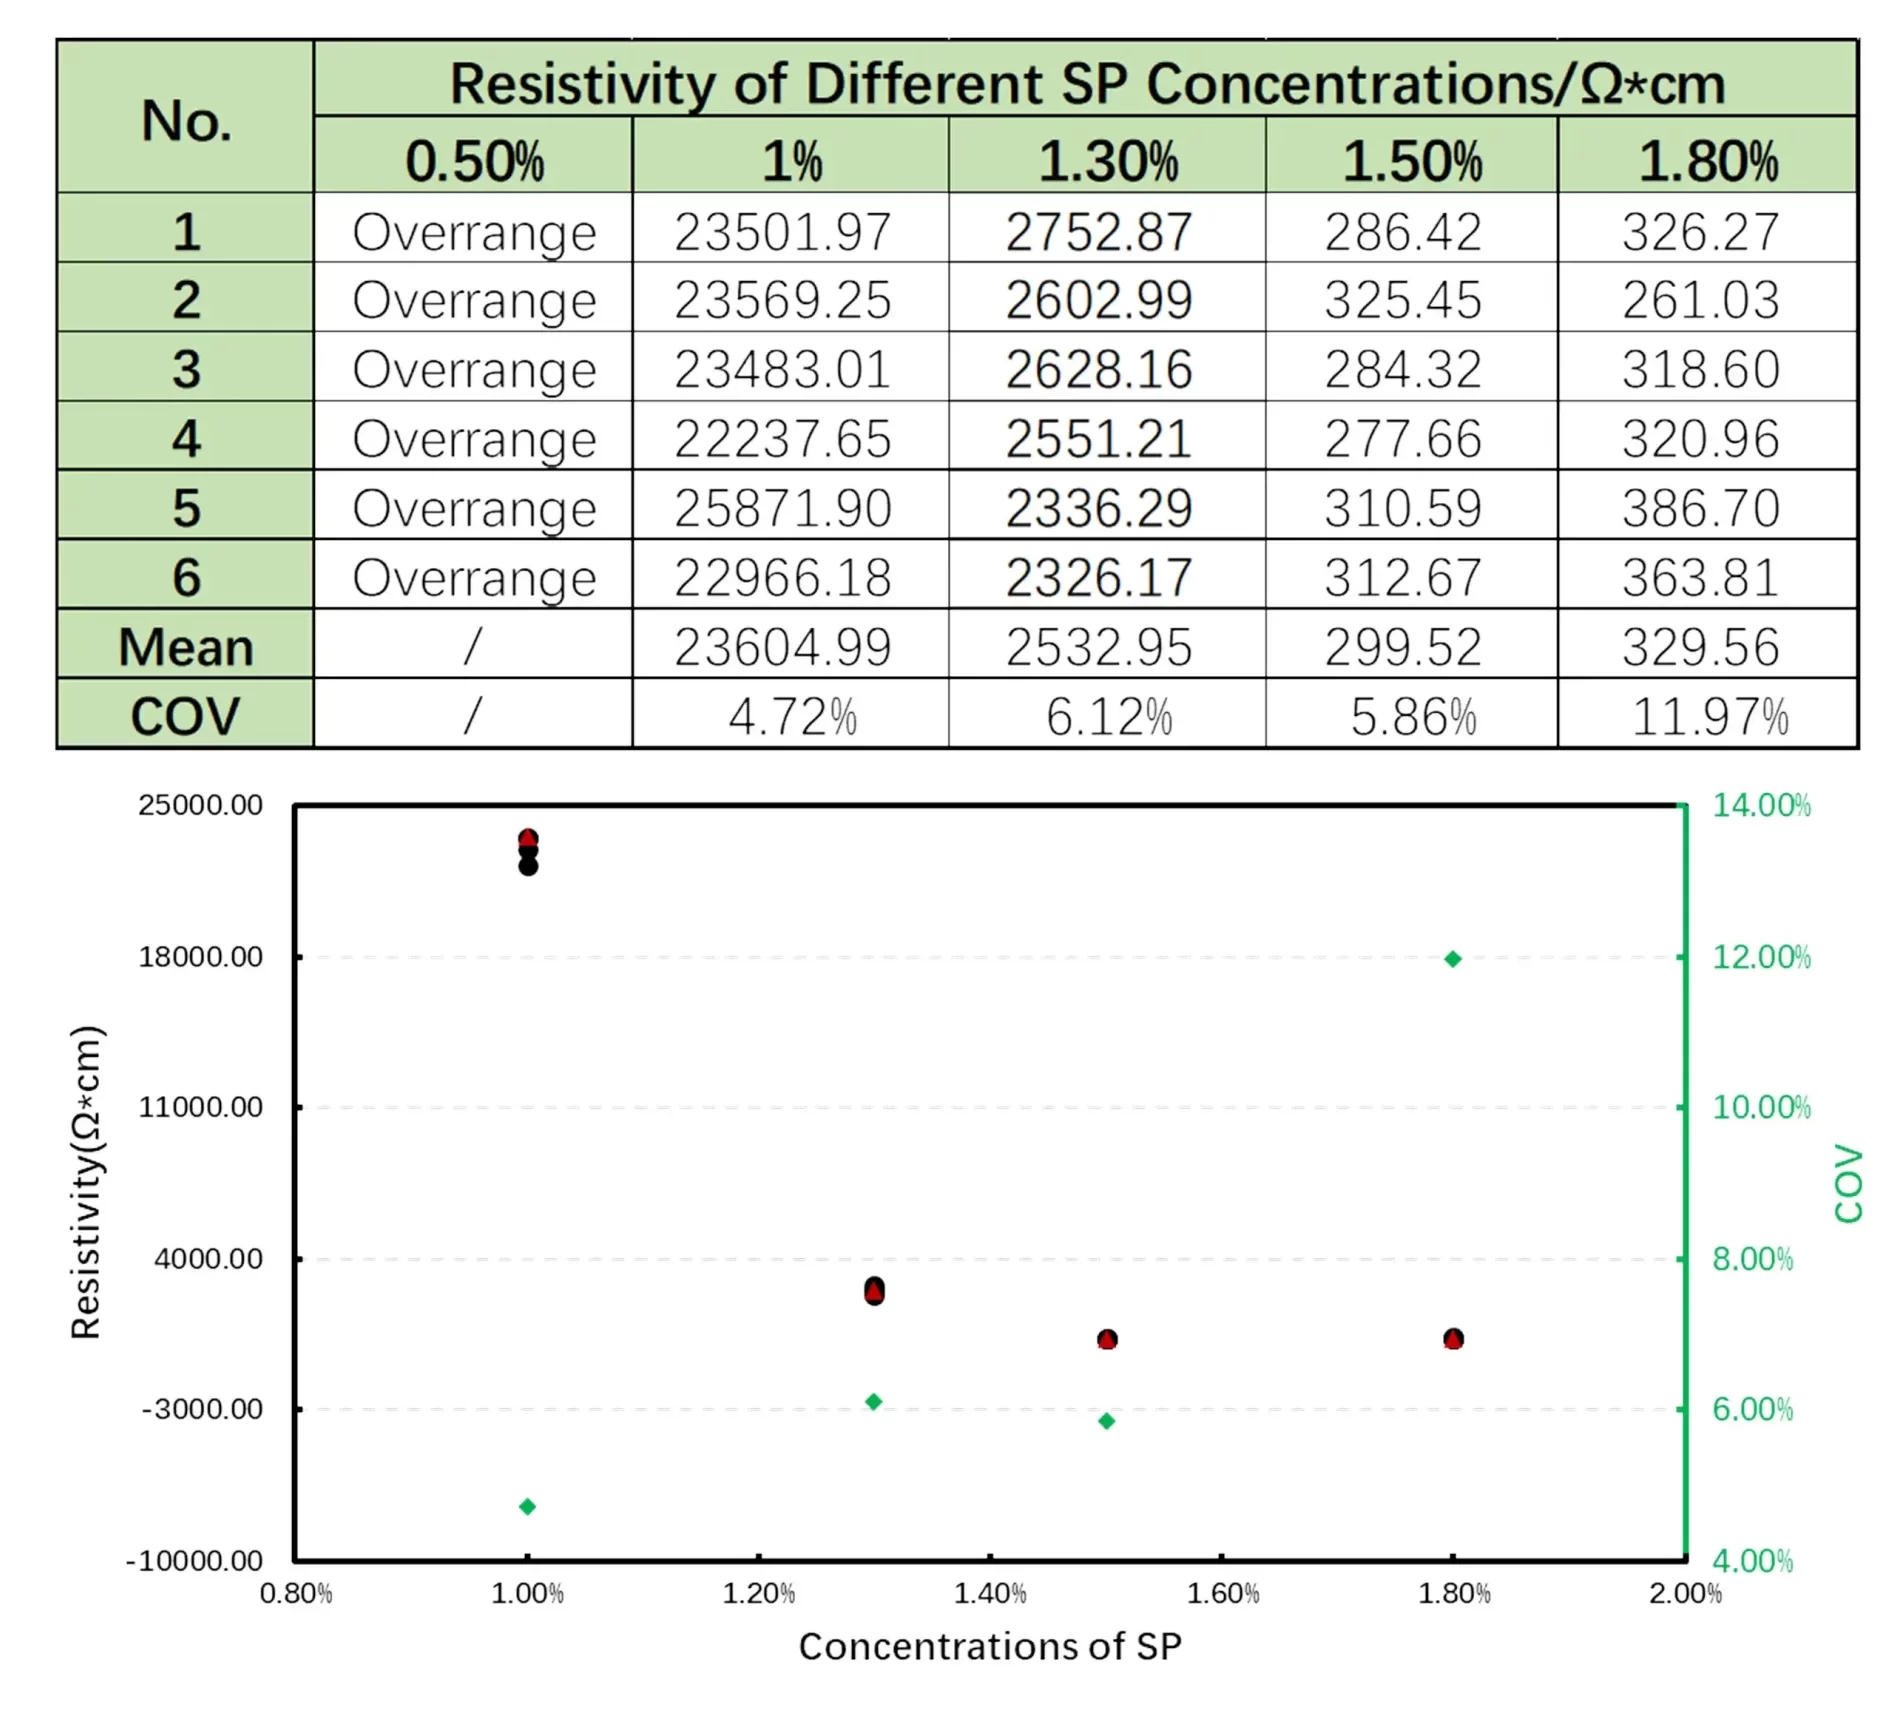
Figure 4. Change in electrode resistivity as conductive additive content increases, measured by IEST BER series at six positions per sample.
| Conductive Additive Content | Electrode Resistivity | Observation |
|---|---|---|
| 0.5% | Beyond measurable range | Electron pathway not yet continuous |
| 1.0% | 23,604.99 Ω·cm | High resistance, conductive network still forming |
| 1.3% | Not individually reported in source data | Within the steep-decline range between 1.0% and 1.5% |
| 1.5% | 299.52 Ω·cm | Sharp decrease of several orders of magnitude — performance inflection point |
| 1.8% | Slight rebound (exact value not reported) | Higher COV; localized agglomeration indicated |
Note: only the 1.0% and 1.5% electrode resistivity values were explicitly reported in the source data; the 0.5%, 1.3%, and 1.8% rows reflect the qualitative trend described in the source without invented figures.
The data clearly show that conductive additive content has a significant effect on electrode resistivity. At 0.5% additive content, the testing equipment recorded values beyond the measurable range. As content increased from 1.0% to 1.5%, electrode resistivity fell dramatically — from 23,604.99 Ω·cm to 299.52 Ω·cm. With further increases, electrode resistivity showed a slight rebound, mirroring the slurry-level behavior and reinforcing the saturation-point pattern. The increased COV at 1.8% additive content indicates greater fluctuation in resistance across different electrode regions, further supporting that the performance inflection point may involve localized agglomeration. Resistance evaluation therefore serves as an effective pre-assessment method for determining an appropriate additive content range, validating that conductive additive incorporation should follow a balancing principle — meeting the minimum requirement for a conductive network while avoiding performance degradation and excessive cost.
| Testing Matrix | Traditional Method | IEST BSR + BER Method | Scientific Value / Improvement |
|---|---|---|---|
| Testing stage | Electrode-level DC resistance only, measured after full electrode fabrication | Slurry-level (BSR series) and electrode-level (BER series) resistivity measured at each additive gradient | Correlates slurry-stage and electrode-stage signals rather than relying on a single downstream measurement |
| Process-issue detection | Formulation or dispersion problems typically discovered only after coating and drying | Slurry resistivity abnormalities can flag issues before coating | Enables earlier identification of abnormal process stages, reducing wasted material and time |
| Spatial uniformity | Single-point or unspecified sampling | Six-position electrode measurement with coefficient of variation (COV) | Quantifies distribution uniformity, not just an average resistivity value |
In lithium battery manufacturing, the addition of conductive additives is not a matter of “more is better” but rather a delicate balancing act among performance, processability, and cost. Our experiments demonstrate that the slurry and electrode resistivities at various additive levels provide an effective evaluation range for determining the optimal additive content, which can be flexibly adjusted based on specific material systems and production line conditions. In the future, breakthroughs in composite conductive additives and innovative dispersion techniques may enable superior performance at even lower additive loadings—a direction that many in the lithium battery industry continue to explore.
IEST’s BSR series slurry resistance analyzer and BER series electrode resistance tester let you correlate slurry-stage and electrode-stage resistivity across additive gradients — flagging process issues before coating and pinpointing your formulation’s performance inflection point.
[1] Ishii M , Makino S , Nakamura H. The role of carboxymethyl cellulose on the rheology of anode slurries in lithium-ion batteries[J]. Current Opinion in Colloid & Interface Science, 2024, 74(000):10.DOI:10.1016/j.cocis.2024.101858.
[2] Jin B , Gu H B , Kim K W. Effect of different conductive additives on charge/discharge properties of LiCoPO4/Li batteries[J].Journal of Solid State Electrochemistry, 2008, 12(2):105-111.DOI:10.1007/s10008-007-0367-4.
[3] Yang L H .Synergetic effect of conductive additives on the performance of high power lithium ion batteries[J].New Carbon Materials, 2012.DOI:10.1016/S1872-5805(12)60026-2.
A conductive additive is a material, such as conductive carbon black or carbon nanotubes, mixed with binder to form the carbon-binder domain (CBD) inside a battery electrode. It builds an interconnected electron-conduction network around active material particles, directly affecting slurry resistivity, electrode resistivity, and rate capability.
In a five-gradient LCO/PVDF/NMP study using SP conductive additive, resistivity dropped steeply from 0.5% to 1.5% loading, then leveled off — with a slight rebound from 1.5% to 1.8% — identifying approximately 1.5% as the performance inflection point for this specific material system. Optimal content varies by formulation and should be confirmed with resistivity testing on the actual production materials.
Slurry resistivity is measured on the mixed electrode slurry before coating, using a slurry resistance analyzer such as the IEST BSR series, and reflects how well the conductive network has formed at the mixing stage. Electrode resistivity is measured on the coated, dried electrode sheet using an electrode resistance tester such as the IEST BER series, and reflects the conductive network’s performance after the full coating process.
Excessive conductive additive increases slurry viscosity, which can cause poor leveling during coating, uneven electrode thickness, and a “fish-scale” surface defect. It can also promote localized agglomeration — “islands” of conductive additive that impede electron transfer between active material particles — along with higher material cost, without further reducing resistivity.
Increasing conductive additive content builds a more continuous electron-conduction network, sharply reducing electrode resistivity up to a certain loading — in one tested system, from 23,604.99 Ω·cm at 1.0% to 299.52 Ω·cm at 1.5%. Beyond that loading, resistivity reduction levels off and may rebound slightly due to localized agglomeration, as reflected in an increased coefficient of variation (COV) across electrode positions.
Choosing conductive additive loading depends on measuring both slurry-stage and electrode-stage resistivity across a range of additive contents for your specific active material, binder, and solvent system, since the inflection point varies by formulation. Paired testing with the IEST BSR series (slurry) and BER series (electrode) allows early detection of process issues and identification of the content level where resistivity gains taper off.
