

Among the manufacturing routes being developed for sulfide all-solid-state batteries, wet-process (slurry-based) coating is widely regarded as the route best positioned for industrialization, because it offers good film uniformity, controllable thickness, and compatibility with continuous, roll-to-roll production similar to today’s lithium-ion battery manufacturing. The central technical challenge is that a sulfide composite electrode must incorporate a continuous ion-transport pathway by mixing solid sulfide electrolyte directly into the electrode, forming a four-phase system of active material, solid electrolyte, conductive agent, and binder. In current wet-process binder formulations, however, the electrolyte and binder can develop a pronounced distribution gradient during coating, which critically affects ion and electron transport through the electrode’s depth.
Several aspects of binder and electrolyte dispersion behavior in sulfide composite electrodes remain unclear: how the binder dissolves in the low-polarity solvents typically used in these formulations, how it interacts mechanically and chemically with sulfide particles, and how binder and electrolyte distribute directionally and across particle surfaces during coating and drying. Mature dispersion-characterization methods developed for liquid-electrolyte batteries, such as zeta potential, rheology, and in-situ imaging, have not been clearly verified as applicable to sulfide composite systems. As sulfide all-solid-state battery capacity is scaled up, electrode area and thickness both increase, which magnifies any coating dispersion non-uniformity: non-uniform dispersion in a large-area electrode can cause local internal resistance differences, hot spots, and short circuits, while in thicker electrodes, binder and electrolyte distribution gradients become more pronounced and further impede ion and electron transport through the electrode’s depth.
Because the applicability of established liquid-battery dispersion characterization methods to sulfide composite systems is not clearly established, a practical question follows: how can the coating dispersion uniformity of a wet-process sulfide electrode be evaluated, and how can coating quality be monitored during production? This article presents an approach using IEST Instrument’s electrode resistance analyzer paired with an automatic electrode powder scraper: by measuring resistivity at a series of controlled electrode thicknesses and plotting the resulting thickness-resistivity relationship, the degree of deviation from an ideal, uniformly dispersed linear relationship can be assessed, offering an alternative to traditional static, single-point testing approaches.
Two IEST Instrument systems form the basis of this characterization method:
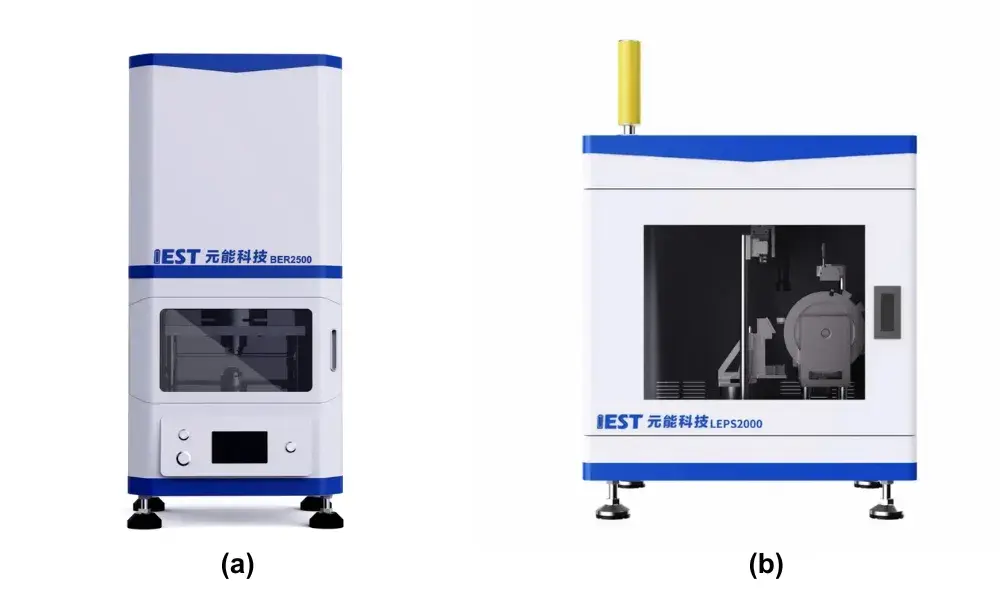
Figure 1. (a) IEST BER2500 electrode resistance analyzer. (b) The IEST LEPS2000 automatic electrode powder sampling system.
The test principle is illustrated in Figure 2. Resistance is first measured on the as-coated electrode (a), which contains active material, LPSCl sulfide electrolyte, binder, and a VGCF conductive additive on a Cu foil current collector. The automatic powder scraper then removes a controlled layer of the coating, and resistance is measured again on the newly exposed, thinner electrode (b). This scrape-and-measure cycle is repeated; the schematic in (c) shows the electrode after five scraping passes, at the sixth resistance measurement. Each resistance measurement uses the configuration shown in (d): a thickness measurement system, a resistance measurement system, and a pressure control system act together on gold-coated copper (Au@Cu) electrodes that sandwich the sample, with current and voltage measured across the sample to obtain resistance.
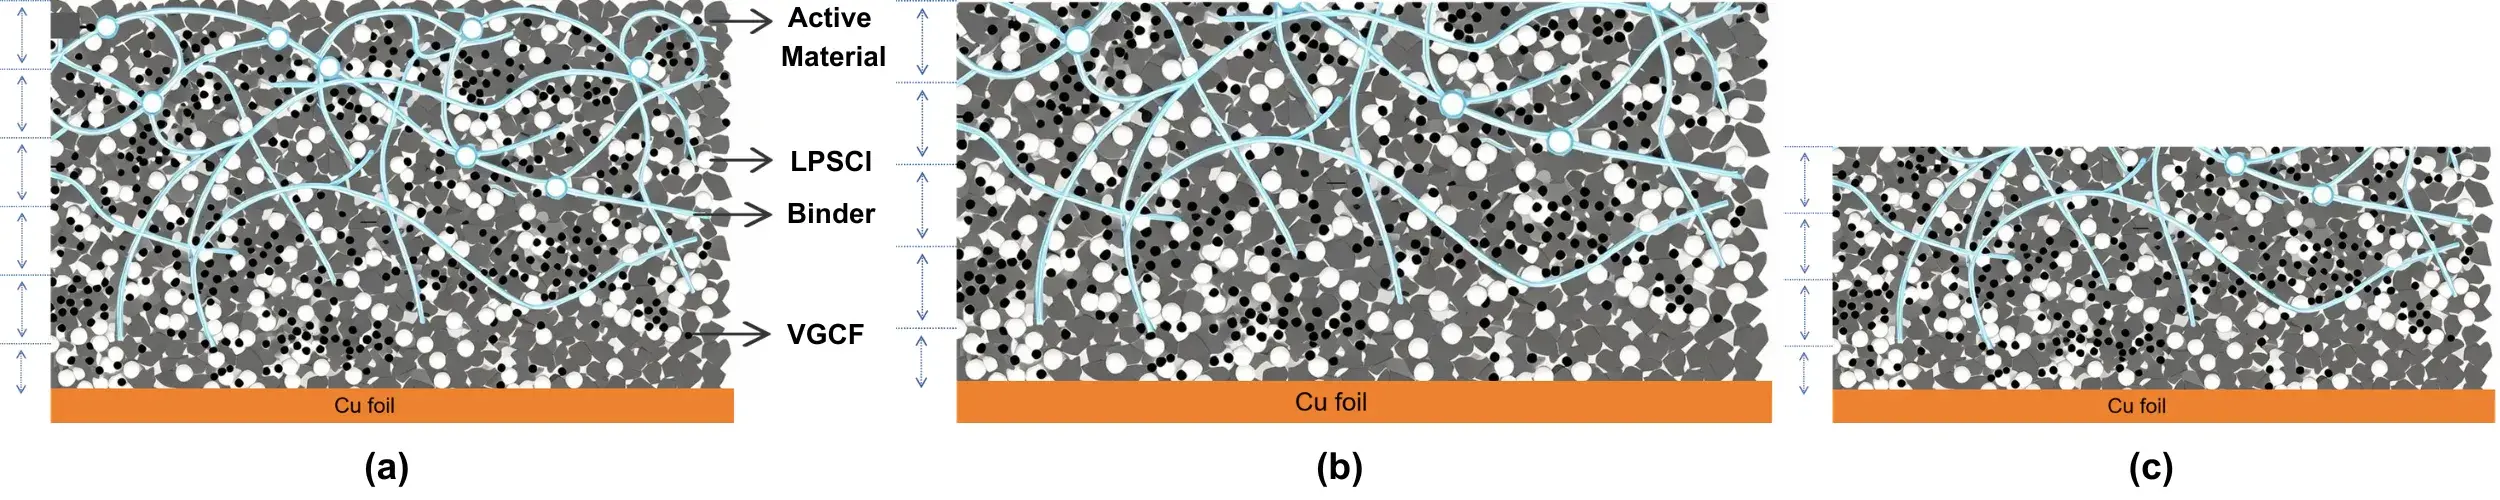
Figure 2. IEST LEPS2000 automatic electrode powder sampling system test principle.
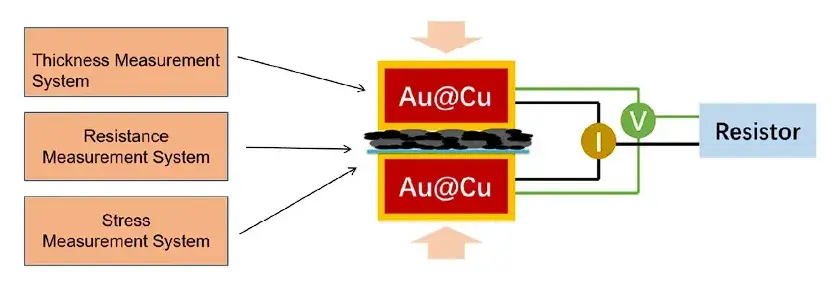
Figure 3. Schematic of the electrode resistance test configuration.
The resistivity formula shown below relates the measured resistance to the sample’s thickness ($l$) and cross-sectional area ($S$): under a fixed test cross-sectional area, if an electrode is well dispersed, resistivity is the same at every depth through the electrode, so resistance and thickness follow a linear relationship. Comparing the resistance-thickness curve obtained from an actual sample against this ideal linear relationship reveals how far the real sample deviates from perfectly uniform dispersion. The same measurement approach is also applicable to ionic conductivity testing (using an optional ionic-conductivity test module), which can likewise be used to assess electrolyte dispersion. In addition, the powder removed at each scraped layer can be analyzed by inductively coupled plasma (ICP) spectroscopy for the sulfide electrolyte’s characteristic elements (P, S, Cl), providing a quantitative, independent measure of the sulfide electrolyte’s through-thickness distribution.
Resistance(Ohm): \(R = \rho \frac{l}{s} + R(else)\)
Because each scraped layer’s powder can be independently analyzed, ICP measurement of the sulfide electrolyte’s characteristic elements provides a way to verify whether the electrolyte has undergone any long-range, cross-scale migration during coating and drying, independent of the resistance-based measurement. Together, the two methods give a more complete picture of how uniformly the solid electrolyte is distributed through an electrode’s depth.
Three groups of sulfide wet-process electrodes were prepared using the same formulation, coating thickness, and coating speed:
Because each layer of Group (C) is coated and dried independently under the same well-mixed conditions, its resulting thickness-resistance relationship should closely approximate the ideal, uniformly dispersed linear curve, making it a useful point of comparison for Groups (A) and (B), where the electrolyte and binder distribution gradient develops within a single, thicker wet coating as it dries.
Figure 4(a) shows that at low coating thickness, the resistance differences among the three groups are relatively small, but as coating thickness increases, the differences become substantially more pronounced. This indicates that under thicker coatings, the upward migration of electrolyte and binder becomes more severe, or the four-phase system’s dispersion uniformity worsens, obstructing the ion/electron-conducting pathways and degrading cell performance. Group (C), built by incremental layer-by-layer coating, produced the resistance curve closest to the ideal linear relationship, with a linear fit of $R^2 = 0.9666$. Group (B), the briefly mixed slurry, showed a resistance-thickness trend that fit an approximately exponential increase rather than a linear one, with a linear fit of only $R^2 = 0.8038$, indicating the poorest dispersion uniformity among the three groups. Group (A), the thoroughly mixed slurry applied as a single coating, fell between the other two, with a linear fit of $R^2 = 0.9322$ — better than Group (B), but still showing a measurable gap from the ideal curve, pointing to room for improvement through process and formulation adjustments.

Figure 4. (a) Resistance versus thickness for sample groups A, B, and C under 5 MPa applied pressure; (b) through-thickness resistivity and coefficient of variation (COV) for each group; (c) through-thickness ICP analysis of phosphorus (P) element content from powder removed at each scraped layer.
The through-thickness resistivity coefficient of variation (COV) for each group, shown in Figure 5(b), follows the same ranking: Group (C) shows the smallest COV at 23.17%, Group (A) an intermediate COV of 49.43%, and Group (B) the largest COV at 78.59%, consistent with Group (C) having the most uniform through-thickness dispersion and Group (B) the least.
The through-thickness ICP analysis of phosphorus (P) content, shown in Figure 5(c), independently supports this conclusion: the more uniformly dispersed an electrode, the more similar the P content is across its layers, and the smaller the resulting COV. Group (C) shows the smallest ICP-based COV at 11.0%, while Group (B), prepared from the briefly mixed slurry, shows the largest COV at 47.6%, indicating that its solid electrolyte moved (migrated) the most during coating and drying. Group (A) falls in between at 20.9%.
This article presents a test method for evaluating dispersion uniformity in wet-process sulfide all-solid-state composite electrodes. By using an automatic powder scraper paired with an electrode resistance analyzer, both electrode resistance and, optionally, ionic conductivity can be measured at a series of controlled thicknesses; combined with ICP as an independent characterization tool, the results cross-validate one another to assess the dispersion of electrode materials, particularly the solid electrolyte. This provides a basis for judging process optimization and formulation improvement, supporting the industrialization of wet-process sulfide all-solid-state battery manufacturing.
Dispersion uniformity is one of several characterization needs for sulfide wet-process electrodes as this manufacturing route scales up. Separately, because sulfide solid electrolytes are known in the literature to be moisture-sensitive and can react with ambient humidity, air stability of the sulfide electrolyte itself remains another material-level characterization challenge relevant to this battery chemistry, alongside the dispersion uniformity method presented here.
The IEST LEPS2000 automatic electrode powder scraper and IEST BER2500 electrode resistance analyzer referenced in this article support the layer-by-layer resistance and ionic-conductivity testing needed to evaluate composite electrode dispersion uniformity.
[1] Jeschke S, et al. All-in-One Ionic–Electronic Dual-Carrier Conducting Framework Thickening All-Solid-State Electrode. ACS Energy Letters, 2022, 7, 880–888.
[2] Recent advances in composite cathodes for sulfide-based all-solid-state lithium-ion batteries. CIESC Journal, 2025, DOI: 10.11949/0438-1157.20251089.
