

As the primary energy storage device for modern electronics and electric vehicles, the performance of lithium-ion batteries is influenced by various factors, with temperature being a critical environmental variable. The separator, a key component in lithium-ion batteries, serves to isolate the positive and negative electrodes to prevent short circuits while allowing lithium ions to move freely through the electrolyte. The separator ionic conductivity of directly affects the battery’s charge-discharge performance and overall efficiency.
Research indicates that temperature variations significantly impact the microstructure of the separator and the ion transport properties of the electrolyte, thereby influencing the separator’s ionic conductivity. As temperature increases, the electrolyte viscosity decreases, accelerating ion migration and enhancing the ionic conductivity of the separator. However, excessively high temperatures may cause softening or melting of the separator material, damaging its porous structure and reducing ion transport efficiency. Conversely, at low temperatures, the electrolyte viscosity increases, slowing ion migration and leading to a decrease in the separator’s ionic conductivity. Therefore, studying the effect of temperature on the ionic conductivity of separators is crucial for optimizing the performance and safety of lithium-ion batteries.
The multi-channel ionic conductivity test system (EIC2400M) developed by IEST was used, as shown in Figure 1. This device includes four test channels, provides a high-purity argon atmosphere, and enables electrochemical impedance spectroscopy (EIS) testing of multi-channel symmetric cells. The pressure range is 10–50 kg, and the frequency range is 100 kHz–0.01 Hz.
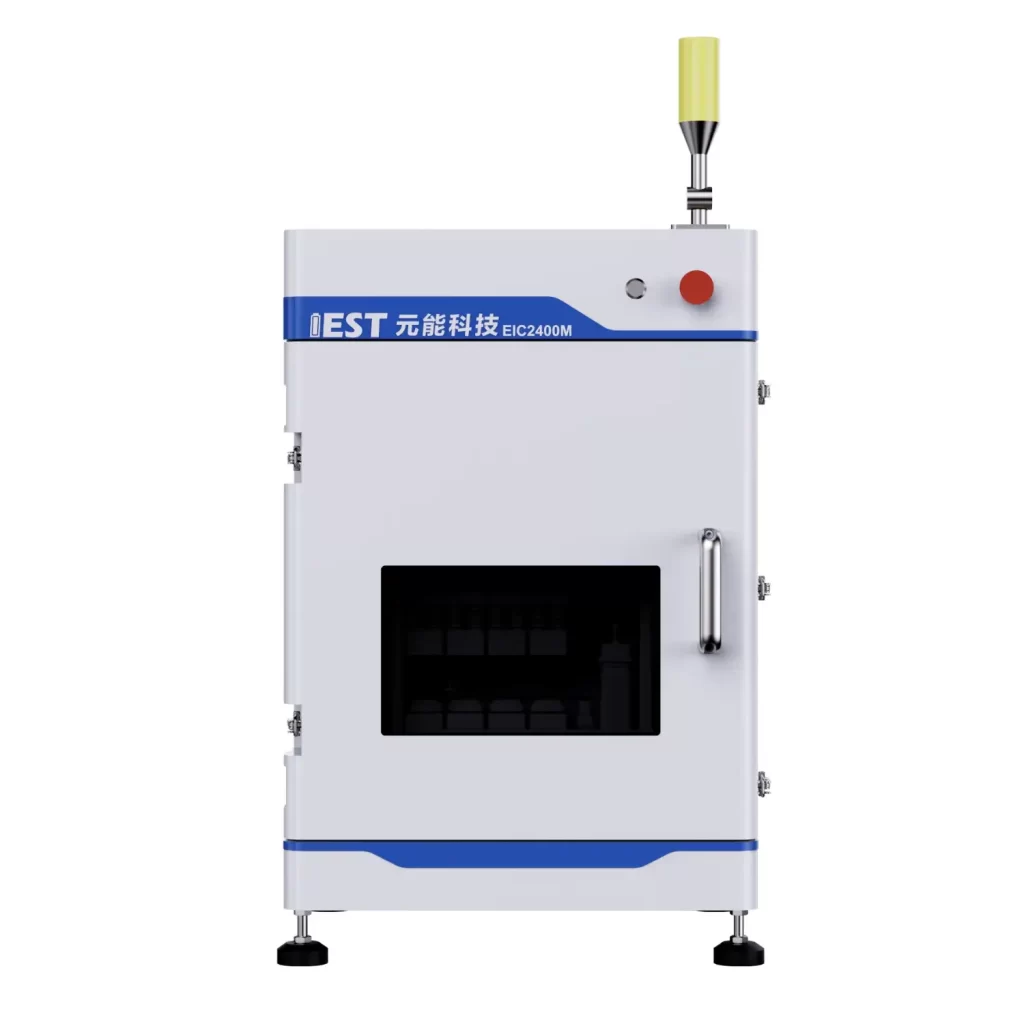
Figure 1. IEST EIC2400M multi-channel ionic conductivity test system, four channels, 10–50 kg pressure range, 100 kHz–0.01 Hz frequency range.
Separator A
The test and calculation process follows these steps:
The calculation method for separator ionic conductivity is as follows: fit the EIS impedance spectra of each separator layer as the baseline. The intersection point of the fitted line with the X-axis is Rs, which represents the ionic resistance Rs(n) of n separator layers, as shown in Figure 2(a). Linear fitting is then performed with the number of layers as the X-axis and the impedance value of each layer as the Y-axis. The slope of the resulting linear fitting equation is the ionic resistance R of a single separator layer, as shown in Figure 2(b).
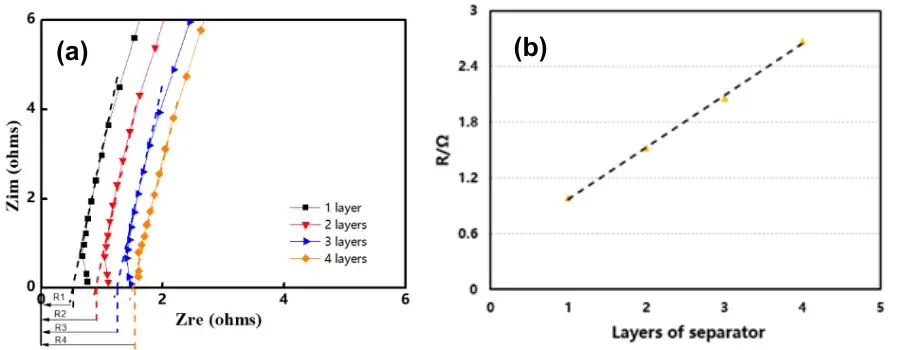
Figure 2. EIS impedance spectra for one to four separator layers measured by IEST EIC2400M (a); ionic resistance R-value linear fitting graph (b).
Substitute the obtained ionic resistance R into Formula 1 to calculate the separator ionic conductivity.
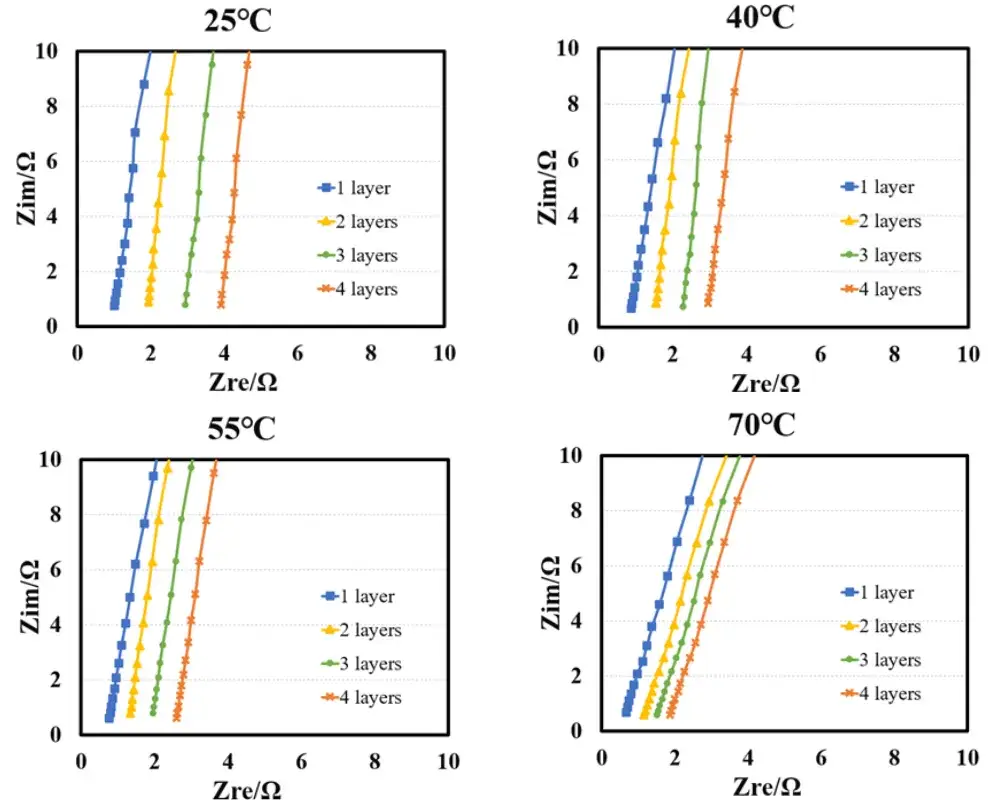
Figure 3. Electrochemical impedance spectra of the ionic separator measured at 25°C to 70°C using the IEST EIC2400M.
| Temperature | 25°C | 40°C | 55°C | 70°C |
|---|---|---|---|---|
| Area / cm2 | 2.01 | |||
| Thickness / µm | 20 | |||
| 1 (Layer) | 0.9657 | 0.7993 | 0.6919 | 0.5012 |
| 2 (Layers) | 1.8781 | 1.4792 | 1.2556 | 0.9148 |
| 3 (Layers) | 2.8958 | 2.2378 | 1.8707 | 1.3611 |
| 4 (Layers) | 3.8609 | 2.8876 | 2.5303 | 1.7093 |
| R / Ω | 0.9703 | 0.7024 | 0.6130 | 0.4070 |
| R2 | 0.9996 | 0.9992 | 0.9988 | 0.9977 |
| σ / mS/cm | 0.7691 | 1.0625 | 1.2174 | 1.8336 |
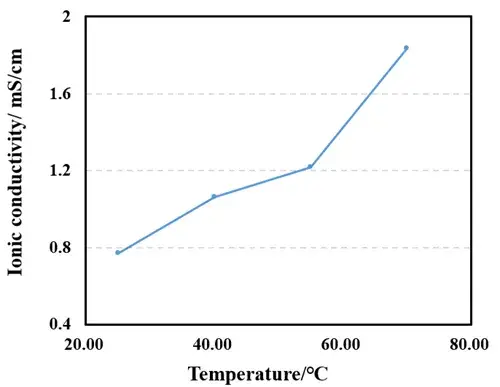
Figure 4. Relationship between separator ionic conductivity and temperature
Figure 3 shows the EIS impedance spectra of the separator measured at different temperatures. Linear fitting was performed using the obtained EIS as the baseline, and the intersection values of the fitted line with the X-axis were recorded. As shown in Table 1, the ionic resistance values R1, R2, R3, and R4 for 1 to 4 separator layers were obtained. Linear fitting was performed with the number of layers as the X-axis and R1, R2, R3, and R4 as the Y-axis to determine the ionic resistance of the separator. The ionic resistance was then substituted into the formula to calculate the ionic conductivity, with the results listed in Table 1. The trend in Figure 4 shows that the separator ionic conductivity significantly increases with rising temperature.
The electrolyte viscosity is a key factor affecting ionic conductivity.
According to the Stokes-Einstein equation, ion migration rate is inversely proportional to the electrolyte viscosity. Therefore, as temperature increases, the electrolyte viscosity decreases, accelerating the migration rate of lithium ions and leading to an increase in the separator ionic conductivity. As shown in Table 1, the separator ionic conductivity increases from 0.7691 mS/cm to 1.8336 mS/cm as the temperature rises from 25°C to 70°C.
In addition to changes in electrolyte viscosity, temperature also affects the microstructure of the separator. The porous structure of the separator is the main channel for lithium-ion transport. As temperature increases, molecular motion in the separator material intensifies, potentially leading to enlarged pores or increased porosity, further promoting ion transport. However, excessively high temperatures may cause softening or melting of the separator material, damaging its porous structure and reducing ion transport efficiency. Separator A exhibits high ionic conductivity at elevated temperatures, indicating that its material maintains good structural stability under high-temperature conditions.
| Temperature | Ionic Resistance Trend | Separator Ionic Conductivity | Mechanism / Implication |
|---|---|---|---|
| 25°C | Higher ionic resistance R | 0.7691 mS/cm | Higher electrolyte viscosity restricts Li+ migration; baseline for room-temperature battery operation |
| Intermediate range | Progressive decrease in R | Rising trend (see Figure 4) | Decreasing electrolyte viscosity and possible pore expansion accelerate ion transport |
| 70°C | Lowest ionic resistance R | 1.8336 mS/cm | Separator A maintains structural stability at high temperature without pore collapse |
IEST Instrument’s EIC2400M multi-channel ionic conductivity test system is a high-throughput characterization platform specifically engineered for the precise determination of electrode tortuosity and separator ion conductivity. Supports four-channel synchronized EIS testing under a high-purity argon atmosphere, with a pressure range of 10–50 kg and a frequency range of 100 kHz–0.01 Hz.
This study experimentally tested the changes in separator ionic conductivity at different temperatures and found that temperature significantly affects the ionic conductivity of separators. As temperature increases, the separator ionic conductivity shows an upward trend, though the rate of change varies among different separators. Separator A demonstrates high ionic conductivity at high temperatures, indicating that its material maintains good structural stability under such conditions.
The impact of temperature on the separator ionic conductivity is closely related to both the microstructure of the separator material and changes in the viscosity of the electrolyte. Therefore, a comprehensive understanding of the effects of temperature on separator microstructure and electrolyte performance is essential for optimizing the performance and safety of lithium-ion batteries. By rationally selecting separator materials and electrolytes, the performance of lithium-ion batteries can be effectively improved across a wide temperature range, extending battery lifespan.
Separator ionic conductivity is a measure of how effectively lithium ions migrate through the porous structure of a battery separator soaked in electrolyte, expressed in mS/cm. It directly affects charge-discharge performance and battery efficiency. Testing on Separator A showed values ranging from 0.7691 mS/cm at 25°C to 1.8336 mS/cm at 70°C.
Ionic conductance increases as temperature rises because electrolyte viscosity decreases, accelerating lithium-ion migration through the separator’s pore structure. Rising temperature can also enlarge pores or increase porosity, further promoting ion transport. However, excessively high temperatures may soften or melt the separator material, damaging its porous structure and reducing conductivity.
Ionic resistance (Rs) is the resistance to lithium-ion transport through a separator layer, obtained from the X-axis intercept of a fitted EIS curve. Ionic conductivity is calculated from ionic resistance using the separator’s thickness and area, expressed in mS/cm. Ionic resistance decreases as ionic conductivity increases with rising temperature.
Selecting equipment for separator ionic conductivity testing depends on channel count, atmosphere control, and EIS frequency range. IEST Instrument’s EIC2400M addresses these requirements with four synchronized test channels, a high-purity argon atmosphere, a 10–50 kg pressure range, and a 100 kHz–0.01 Hz frequency range for accurate impedance-based conductivity calculation.
Industry practice typically expects separator ionic conductivity in the range of 0.5 to 2 mS/cm at room temperature, with values increasing as temperature rises. Separator A tested at 0.7691 mS/cm at 25°C and 1.8336 mS/cm at 70°C, indicating stable performance across this temperature range without structural degradation.
