

The separator is the only cell component that must perform two inherently conflicting functions: (1) electrically insulate the cathode from the anode to prevent internal short circuits, and (2) ionically conduct lithium ions through its electrolyte-filled pore network to enable charge and discharge. The effect of separator coating on electrochemical performance is therefore a first-order design consideration: every coating modification that alters pore structure, surface chemistry, or electrolyte affinity directly impacts both ionic transport efficiency and ultimately battery cycle life.
A separator ionic conductivity is not an isolated material property — it is the net result of three coupled factors: (a) porosity — the volume fraction available for electrolyte uptake; (b) pore connectivity — whether electrolyte-filled pores form continuous ion pathways between cathode and anode; and (c) electrolyte wettability — the separator surface’s affinity for the electrolyte, which determines how completely the pores are filled. The separator wettability and electrolyte uptake for Li-ion batteries are particularly critical for coated separators, where the coating layer must enhance — not compromise — the base material’s wetting characteristics.
| Separator Property | Direct Impact on Cell Performance | Measurement Method |
|---|---|---|
| Ionic Conductivity ($\sigma$) | Determines bulk ionic resistance (\(R_{bulk}\)) — higher $\sigma$ → lower internal impedance → lower voltage drop under load → better rate capability |
EIS on multi-layer separator stacks (100 kHz–10 kHz); IEST EIC2400M |
| MacMullin Number (\(N_M\)) | Ratio of electrolyte-filled separator resistance to free electrolyte resistance — closer to 1 = more efficient ion transport | Derived from σ and free electrolyte conductivity |
| Electrolyte Wetting Rate | Faster wetting reduces manufacturing filling time and ensures uniform Li+ flux during first-cycle formation | Contact angle; time-resolved EIS; IEST EWS/ETS/CHT wetting test system |
| Tortuosity (\(\tau\)) | Describes the effective path length of ion transport — higher τ increases resistance for the same porosity | EIS + porosity measurement; IEST EIC Electrode tortuosity tester |
Table 1 is critical separator properties linking coating modification to cell-level electrochemical performance. Ionic conductivity is the primary screening metric because it captures the combined effects of porosity, pore connectivity, separator wettability and electrolyte uptake, and surface chemistry in a single measurable value.
Note: the methodology described here applies to both ceramic-coated vs polymer-coated separator performance comparisons.
Measuring lithium-ion battery separator ionic conductivity requires a test system capable of high-frequency EIS with precise bulk-resistance extraction across separator stacks of varying layer counts. This study employed two IEST testing systems:

Figure 1. IEST EIC2400M Multi-Channel Separator ion Conductivity Test System — simultaneously measures lithium-ion battery separator ionic conductivity across up to 8 channels with automated EIS fitting (100 kHz–10 kHz frequency range) and one-click σ calculation for rapid separator coating screening.
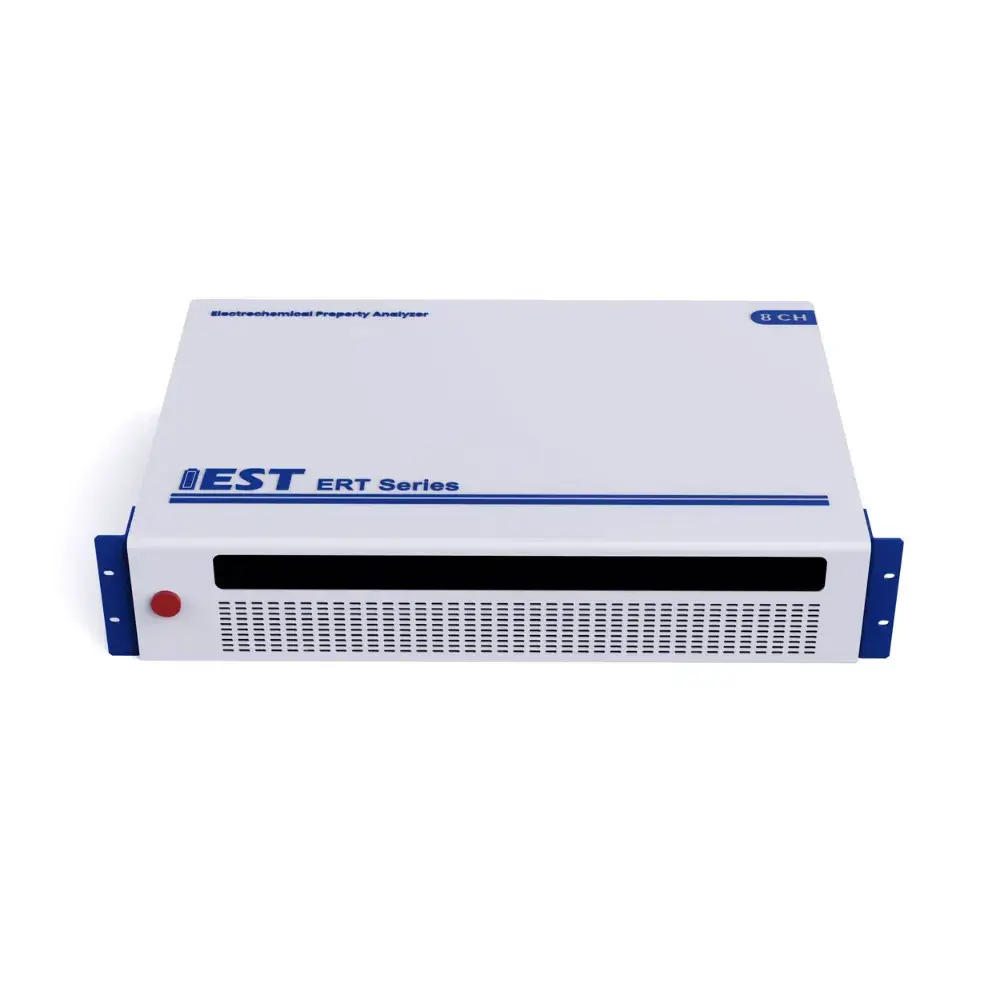
Figure 2. IEST ERT7008 High-Precision Battery Test System — used for LiFePO₄||C coin cell electrochemical impedance spectroscopy (EIS: 100 kHz–0.1 Hz) and 0.2C cycling stability evaluation (100 cycles).
EIS for separator ionic conductivity measurement uses the multi-layer stack method to isolate the intrinsic separator impedance from electrode interface contributions:
| Test Type | Equipment | Configuration | Parameters |
|---|---|---|---|
| Separator Ionic Conductivity | IEST EIC2400M | 1- to 4-layer separator stacks; blocking-electrode SS||SS symmetric cell | EIS: 100 kHz – 10 kHz; voltage amplitude: 10 mV |
| Cell EIS | IEST ERT7008 | LiFePO4||C coin cell | EIS: 100 kHz – 0.1 Hz; voltage amplitude: 10 mV |
| Cell Cycle Stability | IEST ERT7008 | LiFePO4||C coin cell | 0.2C charge/discharge; 100 cycles; 2.5–3.65 V |
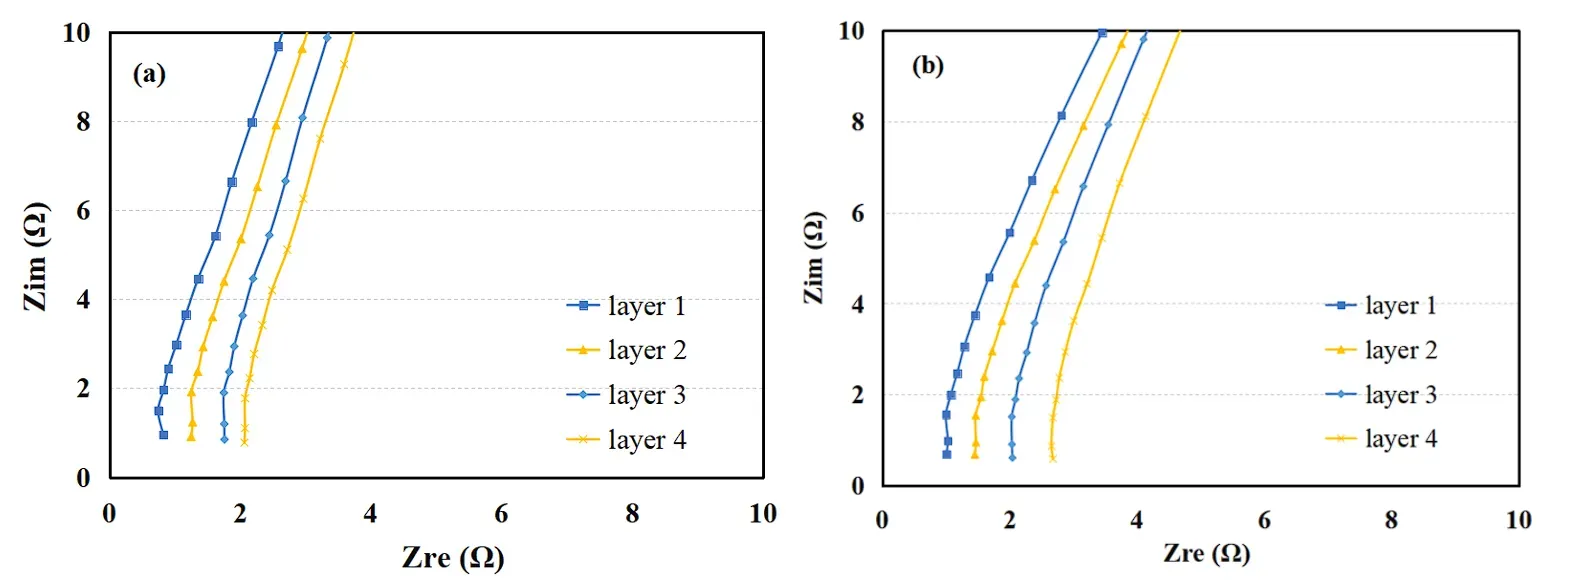
Figure 3. EIS Nyquist plots for (a) Separator A and (b) Separator B measured at 1- to 4-layer stacks. The bulk ionic resistance Rbulk — extracted from the high-frequency x-axis intercept — increases linearly with the number of separator layers, confirming intrinsic separator impedance measurement free from electrode interface artifacts.
The EIS spectra (Figure 3) demonstrate the EIS for separator ionic conductivity measurement principle: as the number of separator layers increases from 1 to 4, the bulk resistance (\(R_{bulk}\), read from the high-frequency intercept) increases proportionally. The linear relationship between \(R_{bulk}\) and layer count confirms that the measured resistance originates from the separator itself. From the slope of this linear fit, ionic conductivity is calculated:
\[\sigma = \frac{L}{R_{bulk} \cdot A}\]
where \(\sigma\) is the ionic conductivity (mS cm\(^{-1}\)), \(L\) is the single-layer separator thickness (cm), \(R_{bulk}\) is the bulk resistance per layer (\(\Omega\)), and A is the electrode area (cm\(^2\)).
| Parameter | Separator A | Separator B |
|---|---|---|
| Area/cm2 | 2.01 | |
| Thickness/μm | 12.00 | |
| 1 | 0.4266 | 0.6391 |
| 2 | 0.9079 | 1.1145 |
| 3 | 1.4361 | 1.7327 |
| 4 | 1.7600 | 2.3888 |
| R/Ω | 0.4529 | 0.5867 |
| R2 | 0.9910 | 0.9950 |
| σ/ mS/cm | 1.3182 | 1.0176 |
| Separator | Ionic Conductivity (mS cm−1) | Relative Advantage | Coating Modification Implication |
|---|---|---|---|
| Separator A | 1.3182 | +29.5% | Optimized coating provides superior electrolyte wettability and more interconnected pore structure — demonstrating the effect of separator coating on electrochemical performance |
| Separator B | 1.0176 | Baseline | Coating may partially occlude pore openings or reduce effective porosity, increasing tortuosity |
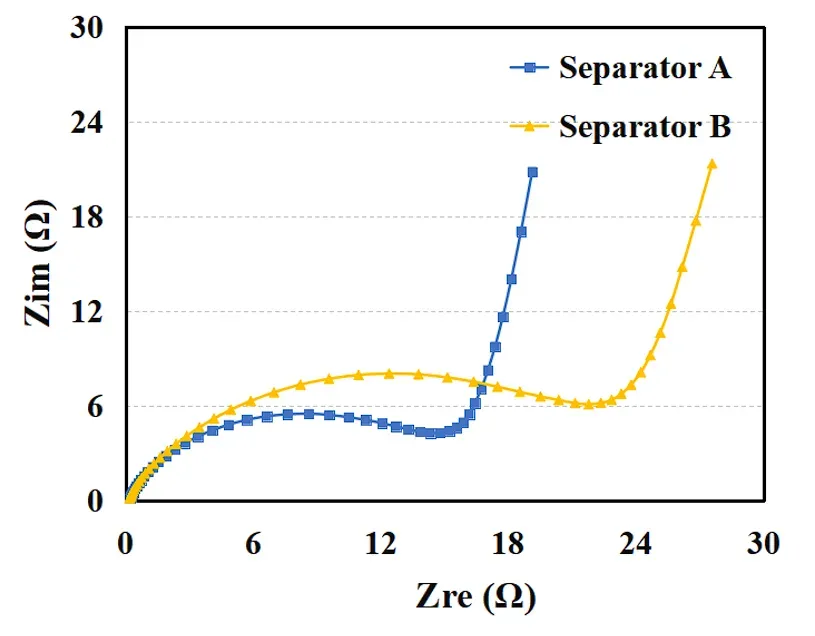
Figure 4. LiFePO\(_4\)||C coin cell EIS comparison. The Separator A cell (higher \(\sigma\)) exhibits lower \(R_{bulk}\) (high-frequency intercept) and lower \(R_{ct}\) (mid-frequency semicircle diameter) — confirming the effect of separator on battery charge transfer resistance extends beyond bulk transport to electrode kinetics.
Coin cell EIS (Figure 4) confirms that the separator-level ionic conductivity difference propagates to measurable cell-level impedance. Two observations are notable: (1) the high-frequency intercept (\(R_{bulk}\)) is lower for the Separator A cell — consistent with its higher σ; and (2) the mid-frequency semicircle (\(R_{ct}\)) is also smaller. This second observation is mechanistically significant: it demonstrates the effect of separator on battery charge transfer resistance — better ionic transport through the separator promotes more uniform Li⁺ flux distribution at the electrode interfaces, reducing localized charge-transfer bottlenecks that contribute to capacity fade.
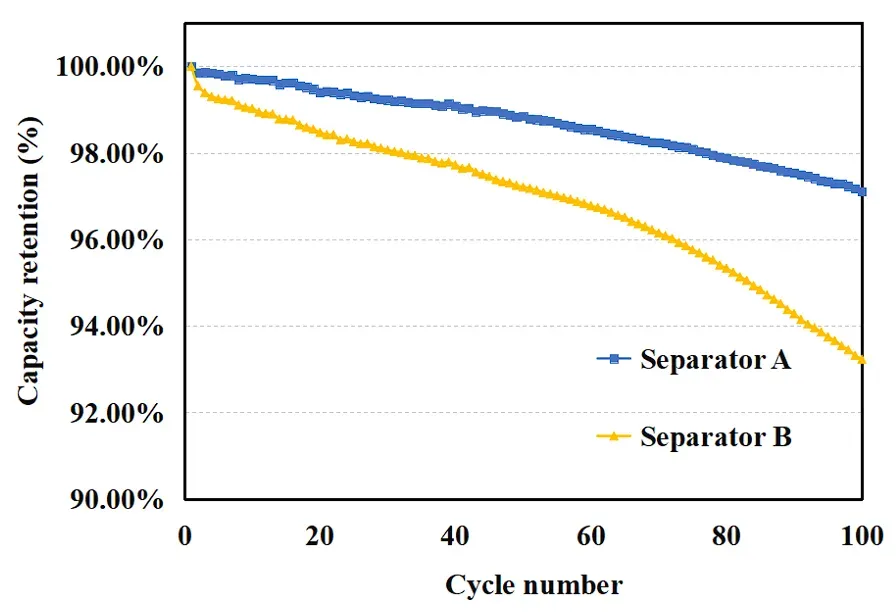
Figure 5. LiFePO₄||C coin cell cycling performance at 0.2C over 100 cycles. Separator A (1.3182 mS cm⁻¹) = 97.11% capacity retention; Separator B (1.0176 mS cm⁻¹) = 93.23% retention. The 4-percentage-point gap quantitatively validates the separator ionic conductivity and battery cycle life correlation.
After 100 cycles at 0.2C, Separator A’s cell retains 97.11% versus 93.23% for Separator B — a statistically significant 3.88-percentage-point improvement. This separator ionic conductivity vs battery capacity fade relationship operates through a clear mechanism: higher σ enables more uniform Li⁺ flux distribution during each charge/discharge cycle, reducing localized overpotential regions that accelerate electrolyte decomposition and progressive solid-electrolyte interphase (SEI) growth — the primary drivers of gradual capacity fade in lithium-ion cells.
| Cycle Metric | Separator A Cell | Separator B Cell | Δ (A – B) |
|---|---|---|---|
| 100-Cycle Capacity Retention | 97.11% | 93.23% | +3.88% |
| Average Coulombic Efficiency | ~99.7% | ~99.3% | +0.4% |
| Separator σ (mS cm−1) | 1.3182 | 1.0176 | +29.5% |
This study establishes the separator ionic conductivity and battery cycle life correlation as a quantitative, experimentally validated relationship:
In separator coating modification development, ionic conductivity should be treated as a primary go/no-go performance gate alongside mechanical strength, thermal stability, and electrolyte wettability. The validated correlation provides a practical framework that minimizes the number of full-cell cycling iterations required — accelerating process optimization while maintaining data-driven decision quality.
The IEST EIC2400M Multi-Channel Ion Conductivity Test System measures separator ionic conductivity across up to 8 channels simultaneously — with automated EIS fitting (100 kHz–10 kHz) and one-click σ output — enabling researchers to rapidly quantify separator ionic conductivity and screen separator performance before committing to time-intensive cell assembly and cycling tests.
[1] Huang S., Xie D., Bao L., et al. Layer-by-layer self-assembly modified polypropylene separator and its performance study. Plastics Science and Technology, 2026, 54(03): 156–161.
[2] He C. Preparation and battery performance of polypropylene lithium-ion battery separator modified by functionalized nano-SiO₂. Tianjin University of Technology, 2025.
Separator ionic conductivity (σ, in mS cm⁻¹) quantifies the rate at which lithium ions migrate through the electrolyte-filled separator. Measuring lithium-ion battery separator ionic conductivity uses EIS for separator ionic conductivity measurement: the separator is stacked in 1–4 layers between blocking electrodes, EIS is recorded from 100 kHz to 10 kHz, and the bulk resistance (Rbulk) at each layer count is extracted from the Nyquist high-frequency intercept. σ is then calculated as σ = L / (Rbulk × A). The IEST EIC2400M automates this process with one-click fitting and conductivity output across up to 8 channels simultaneously.
The separator ionic conductivity and battery cycle life correlation operates through two linked mechanisms: (1) higher σ reduces bulk ionic resistance, lowering cell internal impedance and operating temperature — both of which slow electrolyte degradation; (2) more uniform Li⁺ flux distribution reduces localized overpotential regions where solvent decomposition and progressive SEI growth concentrate, which are the primary drivers of capacity fade. In this study, a 29.5% higher σ (1.3182 vs. 1.0176 mS cm⁻¹) produced a 4-percentage-point improvement in 100-cycle retention (97.11% vs. 93.23%) — directly validating the separator ionic conductivity vs battery capacity fade relationship.
Ionic conductivity (σ, mS cm⁻¹) measures the absolute lithium-ion transport rate through the separator-electrolyte composite. The MacMullin number (NM) is a dimensionless ratio comparing this value to the conductivity of the free electrolyte alone — NM = σelectrolyte / σseparator+electrolyte. An NM close to 1 indicates that the separator imposes minimal additional resistance beyond the electrolyte itself. Both metrics are useful: σ provides an absolute material benchmark, while NM isolates the structural contribution of the separator from the electrolyte’s intrinsic properties.
How to screen separator performance by ionic conductivity is a strategic workflow question. In separator coating development, each formulation iteration requires validation. Full-cell assembly and cycling takes weeks per iteration. The alternative — validated by this study — is to measure σ on separator stacks using the IEST EIC2400M, which returns quantitative results in minutes. A σ threshold (e.g., >1.2 mS cm⁻¹ for PP-based separators in standard LiPF₆ electrolyte) can serve as a go/no-go gate: formulations above the threshold advance to cell-level testing; those below are revised or discarded. This σ-first screening approach can reduce total development cycle time by 60–80%.
Separator wettability and electrolyte uptake for Li-ion batteries are fundamental prerequisites for ionic conductivity. A separator with poor wettability will trap air in its pore network, reducing effective electrolyte-filled porosity and creating localized dry spots — both of which increase Rbulk. Furthermore, incomplete wetting creates non-uniform current distribution at electrode interfaces, increasing the effect of separator on battery charge transfer resistance (Rct). This study’s Separator A benefited from a coating modification that simultaneously improved wettability (faster electrolyte uptake) and ionic conductivity (29.5% higher σ), producing lower Rbulk and Rct compared to Separator B.
Ceramic-coated vs polymer-coated separator performance depends critically on the coating morphology, not just the coating chemistry. Ceramic coatings (e.g., Al₂O₃, SiO₂) generally improve thermal stability and wettability due to their hydrophilic surface chemistry, but if the ceramic layer is too dense or thick, it may increase tortuosity and reduce ionic conductivity. Polymer coatings (e.g., PVDF, aramid) can form gel-like interfaces with the electrolyte that enhance ion transport, but may swell excessively or block pore openings if applied non-uniformly. In practice, the optimal coating strategy depends on the target application: ceramic coatings are preferred for high-temperature safety, while thin polymer coatings can maximize σ for high-rate applications. The IEST EIC2400M provides the quantitative σ measurement needed to objectively compare coating strategies.
