-
iestinstrument

Abstract
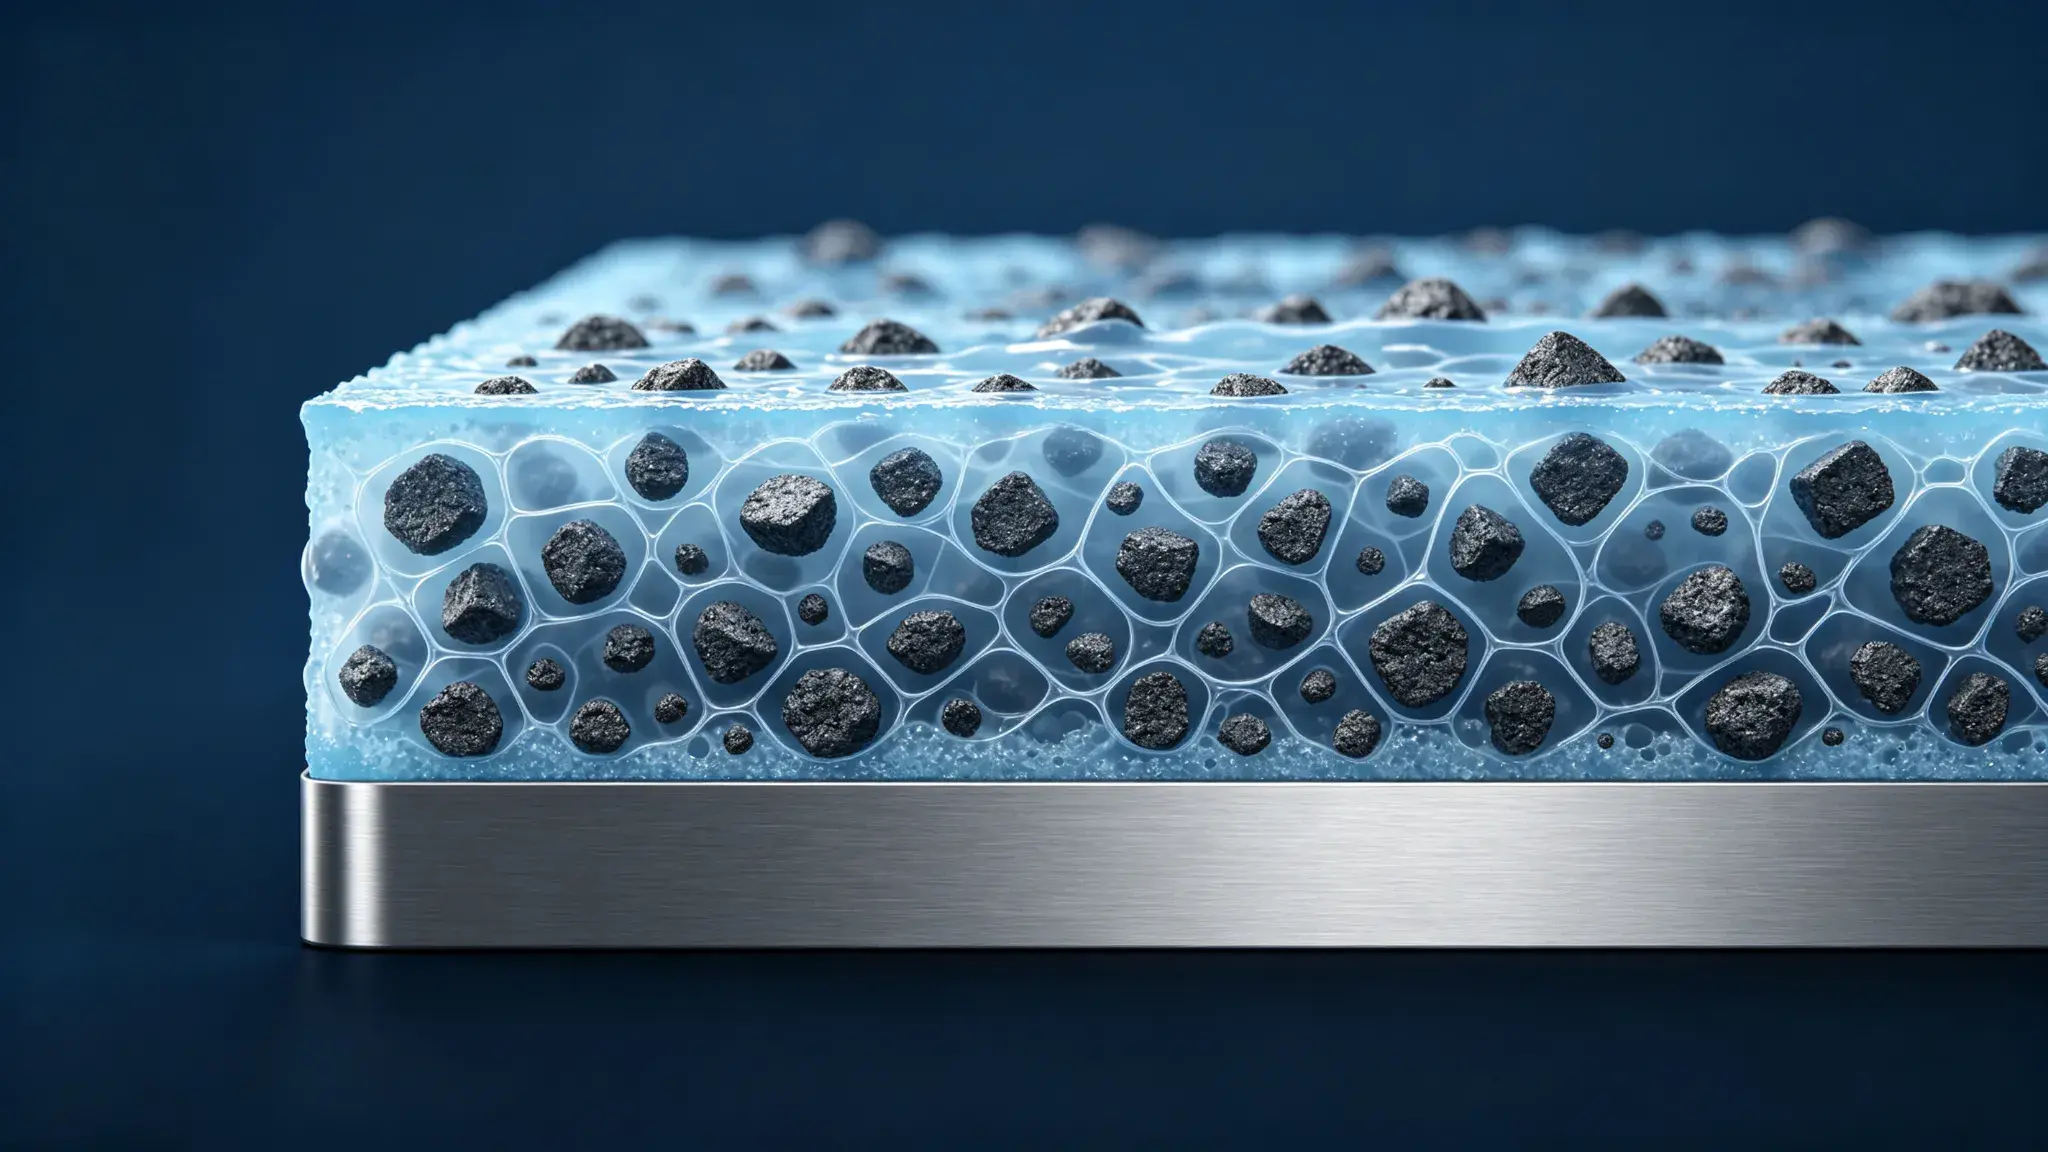
Figure 1. 3D Microstructural Model of Porous Battery Electrode & Particle-Binder-Current Collector Interface.
1. Why Does Binder Distribution Matter if the Binder Fraction Is Small?
Battery electrode binders often account for only a small fraction of an electrode formulation, yet they perform several functions that cannot be replaced by active material or conductive additive alone. The cited Nature Communications paper states that polymeric binders occupy less than 5% of electrode volume. This is a volume-based statement; binder fractions are also reported by mass in formulation specifications, so the basis should always be stated explicitly.
In a conventional aqueous graphite anode, sodium carboxymethyl cellulose (CMC) and styrene-butadiene rubber (SBR) are commonly used together. CMC contributes to slurry rheology and particle-network cohesion, while SBR contributes elastic binding and coating adhesion. Their spatial arrangement matters as much as the total amount: a coating can meet its average binder-content target and still contain locally binder-rich and binder-lean regions.
- Particle cohesion: Binders help maintain contact among active material and conductive carbon.
- Coating adhesion: Binders help anchor the coating to copper or aluminium current collectors.
- Pore and transport structure: Binder distribution can affect pore accessibility, local electronic connectivity, and electrolyte-ion transport.
When binder distribution becomes non-uniform, electrode performance degrades through two progressive positive-feedback pathways rather than a simple “non-uniformity leads to failure” relationship.
1.1 Pathway 1: Mechanical Heterogeneity Induces Micro-Crack Propagation and Progressive Pulverization
Binder distribution non-uniformity creates significant spatial heterogeneity in bonding strength, deformation resistance, and fatigue performance across different electrode regions. For graphite anodes, this manifests as progressive local debonding and micro-crack propagation. For silicon-based anodes, the approximately 300% volume expansion during lithiation repeatedly amplifies mechanical heterogeneity — weak regions experience preferential mechanical failure, progressively evolving into electrochemical deactivation and ultimately cascading regional pulverization.
The entire process follows a progressive pattern: mechanical structural heterogeneity → local mechanical failure → electrochemical deactivation → cascading regional pulverization. The large volume effect of silicon anodes significantly amplifies this positive feedback process, which is the core reason why silicon-based systems are highly sensitive to binder processing.

Figure 2. Silicon Anode Volume Expansion, Fracture & Cycling Pulverization Failure Model.
1.2 Pathway 2: Transport Non-Uniformity Induces Spatial SOC Heterogeneity
Binder materials are electronic insulators and low ionic conductors. Their non-uniform distribution disrupts transport uniformity from both electronic and ionic dimensions, directly causing localized reaction rate differentiation. Two direct consequences emerge:
- Conductive additive dispersion failure: Local electronic conduction pathways break, causing non-uniform electron transport.
- Porosity distribution distortion: Pores in binder-rich regions become blocked, impeding ionic transport.
Together, these effects cause significant differences in electrochemical reaction rates and extents across electrode micro-regions — essentially spatial SOC (state of charge) heterogeneity. This leads to increased variation in volume expansion across regions, further damaging the binder network and pore structure, which in turn exacerbates transport non-uniformity.
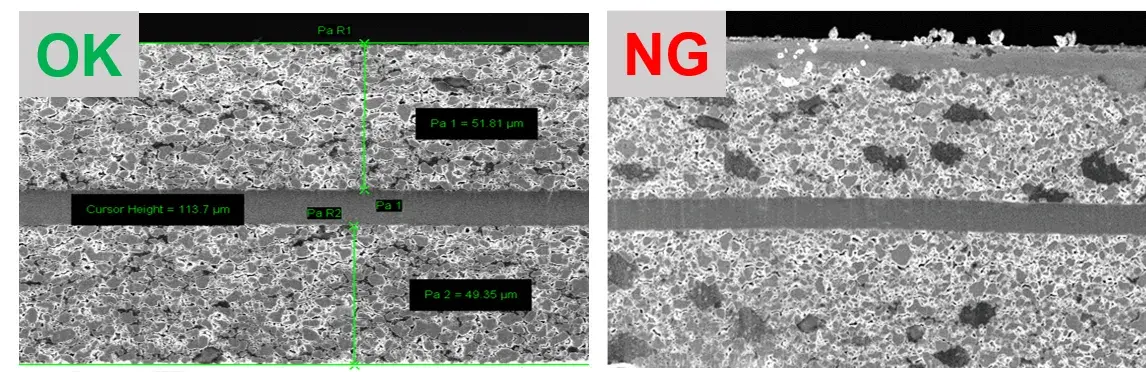
Figure 3. Conductive additive dispersion failure — OK vs. NG electrode cross-sections. Non-uniform distribution (NG) shows severe agglomeration and blocked transport pathways.
These two pathways do not operate independently. Mechanical structural damage exacerbates transport and conductivity non-uniformity, while transport non-uniformity amplifies mechanical deformation differences. Their coupling accelerates electrode performance degradation.
2. How Academia Visualizes Binder Distribution
Over the past decade, academic researchers have developed a comprehensive toolkit for “seeing” binder distribution. Five representative works cover nearly all mainstream approaches.
2.1 Chemical Staining + Electron Microscopy (Frontier, Emerging)
Zankowski et al. (2026) developed selective staining approaches for the widely used aqueous binders CMC and SBR. The team combined chemical staining with electron imaging and energy-dispersive X-ray spectroscopy (EDX) to identify binder domains that are difficult to distinguish in an unstained graphite electrode. The study also examined electrodes containing silicon-based active materials.
The central contribution is methodological as well as mechanistic: it makes previously difficult-to-observe binder structures visible and connects binder distribution with electrode processing. The research describes nanoscale binder films on graphite surfaces, binder/carbon agglomerates, drying-induced migration and disruption of binder films during calendering. It also demonstrates that changing the initial slurry-mixing sequence can reduce carbon–binder-domain agglomeration and electrical resistivity.
The paper reports that increasing the CMC concentration during an initial pre-mixing step from 1.5 wt% to 3 wt%, followed by dilution to the same final water fraction, reduced large carbon–binder-domain agglomeration. The supplied source summary quantifies the large-agglomerate density as decreasing from 8.5 to 0.4 clusters mm−2. Four-point-probe measurements showed a 14 ± 2% reduction in mean electronic resistivity in the modified coatings. The abstract separately reports a 40% decrease in electrode ionic resistance associated with binder-informed manufacturing optimization.
The most important finding: before calendering, CMC completely covers graphite surfaces (92% coverage). After calendering, coverage drops to approximately 32% — the binder film shatters into fragments covering less than one-third of the surface.
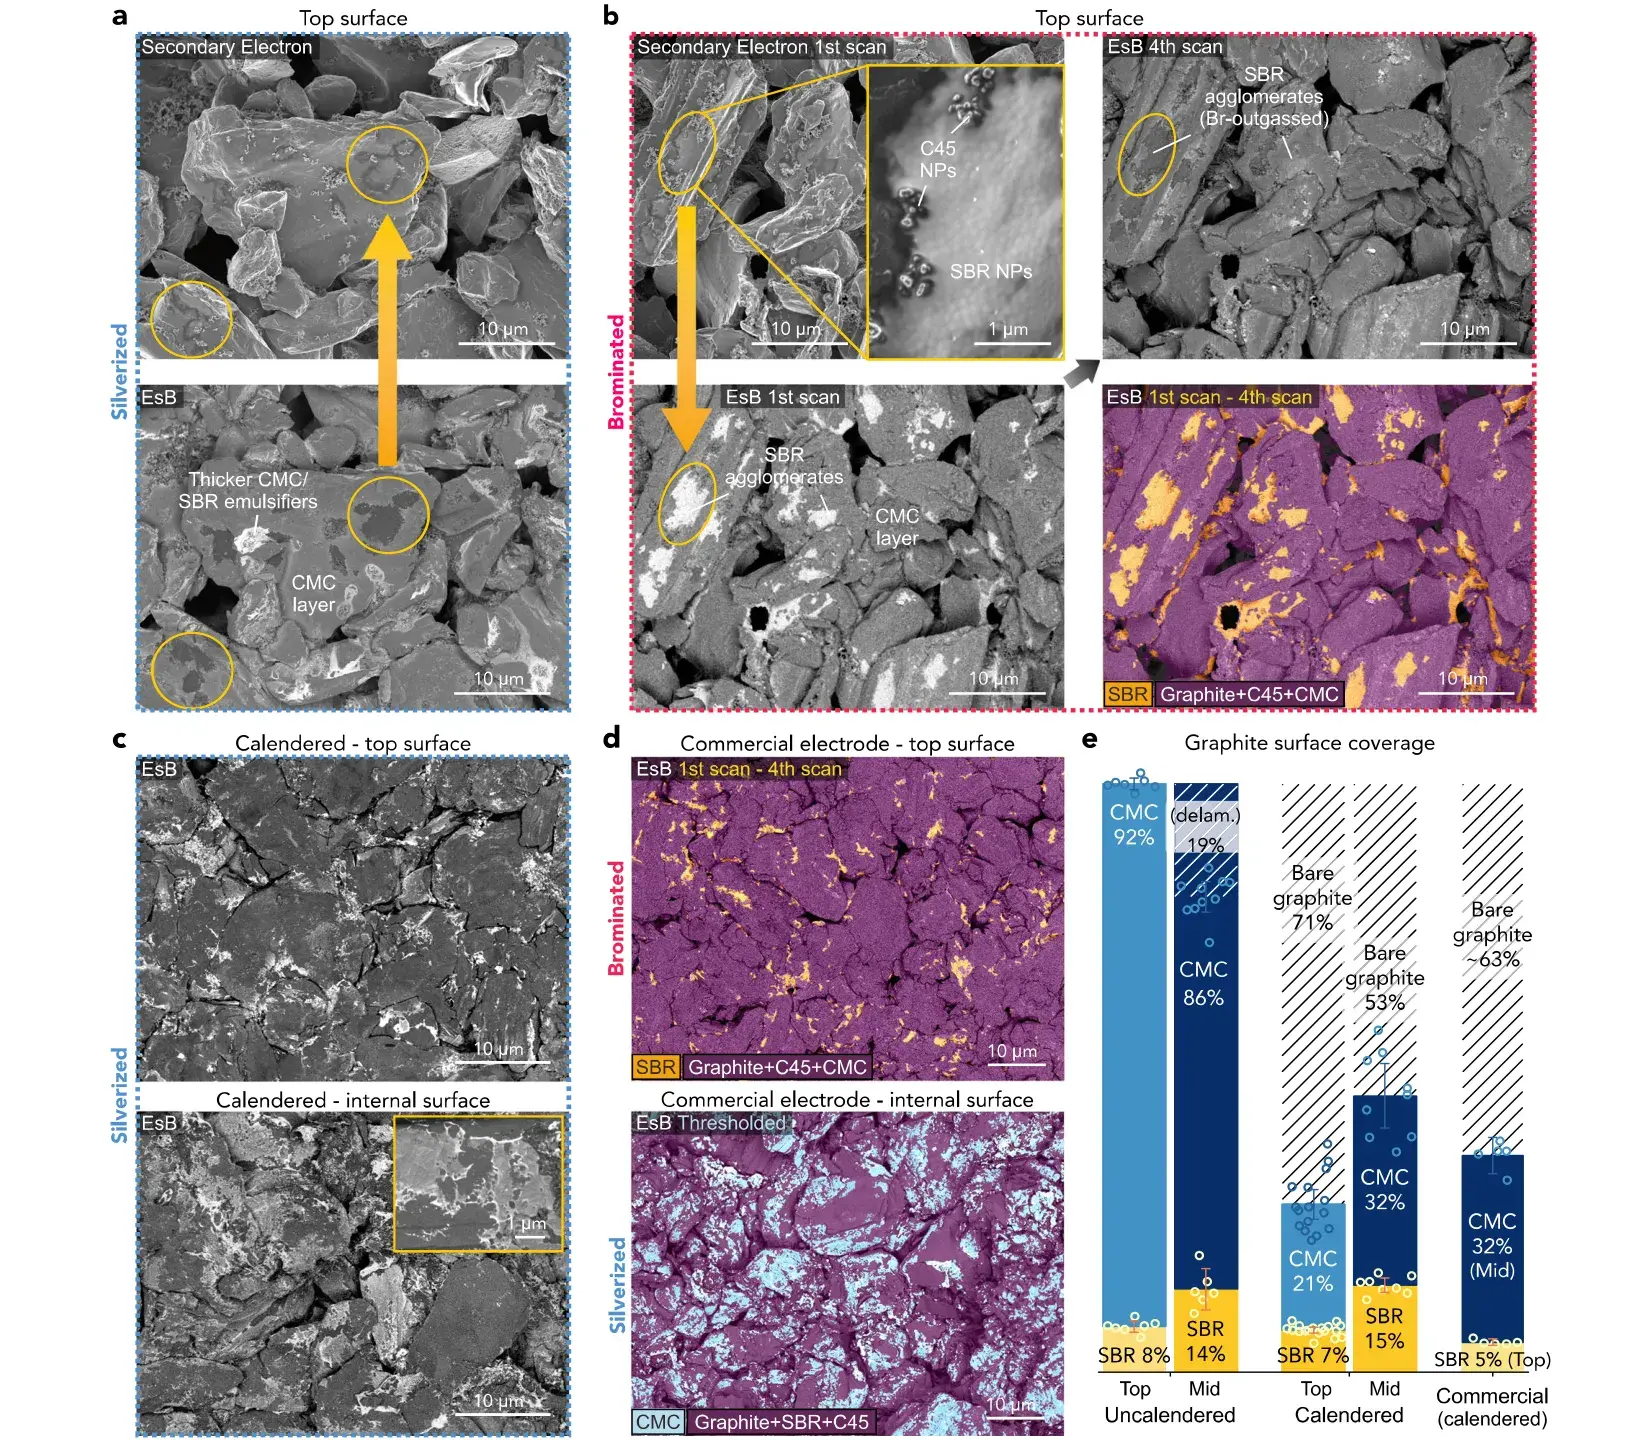
Figure 4. Chemical staining and EsB imaging reveal near-complete CMC coverage on pristine graphite surfaces and extensive film fracture after calendering. The study reports approximately 90% initial coverage, 32 ± 5% internal coverage after calendering and 21 ± 3% coverage on the roller-contacting top surface.
2.2 Raman Spectroscopy Along Thickness Direction (Toyota, 2014)
During drying, solvent evaporation creates coupled concentration and flow fields. If the drying rate and binder transport are poorly matched, water-processable binders such as SBR can become enriched near the coating surface while the lower coating becomes binder-lean. The result may be a surface region with restricted pore access and a weaker coating/current-collector interface.
The source article summarizes a Raman-depth-profiling study by Hagiwara and colleagues at Toyota Technical Center. In that approach, SBR is tracked using a characteristic Raman band near 1001 cm−1, while graphite is tracked near 1360 cm−1; a calibrated intensity ratio is then used to estimate the SBR distribution through the coating. Under the reported 150°C forced-convection drying condition, the near-surface SBR concentration rose to almost three times the bottom-layer level after roughly 30 seconds. The room-temperature, no-airflow condition showed a much more uniform profile over the reported period.
The broader lesson is that drying conditions can be “recorded” in the final binder map, so binder distribution is a useful response variable when optimizing oven temperature, airflow, coating thickness and formulation.
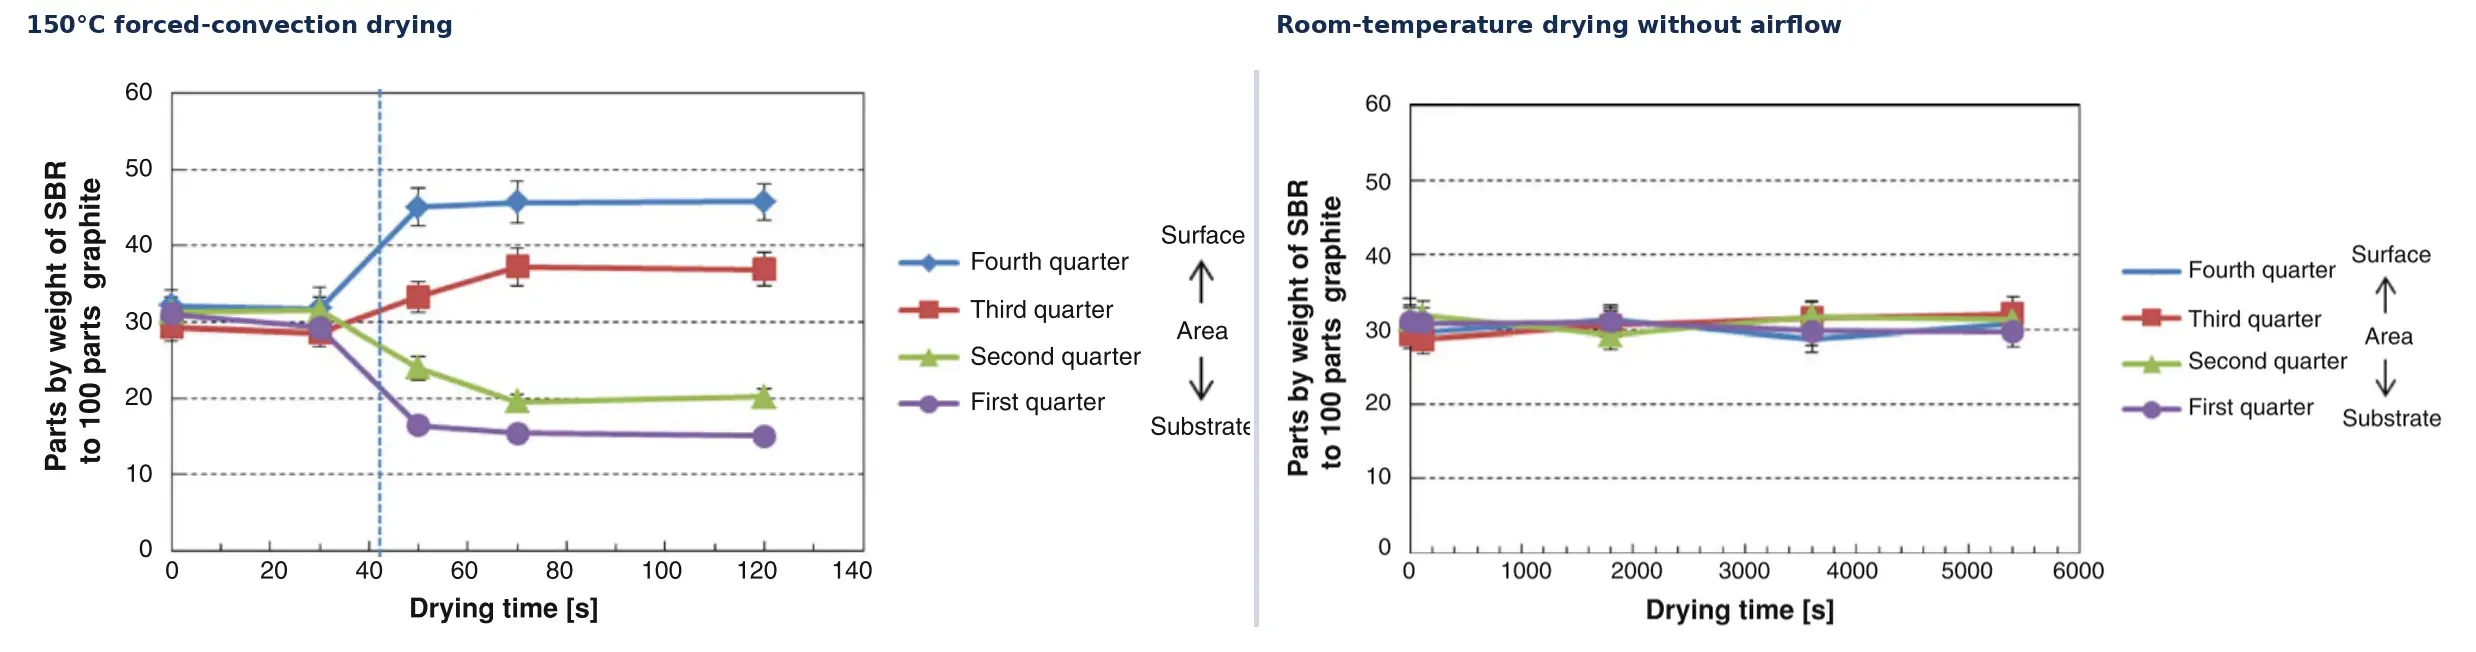
Figure 5. SBR concentration along thickness direction under 150°C convection and room-temperature drying conditions.
2.3 Multimodal Metrology Suite (UCL, 2022)
Zhang and colleagues at University College London published in Journal of Materials Chemistry A a comprehensive study combining X-ray CT (3D active material distribution), FIB-SEM-EDS (binder distribution), 180° peel testing (mechanics), and coin cell testing (electrochemistry) across five drying temperatures.
Key conclusion: The room-temperature-dried NMC622 cathode had the highest measured adhesion force (0.015 N mm−1) and the best rate performance; within the 60–120°C group, capacity and adhesion trends increased with drying temperature as C-rate rose. The graphite anodes showed no clear electrochemical trend across the same temperature range, because water’s boiling point (100°C) creates a short “time-segregation window.”
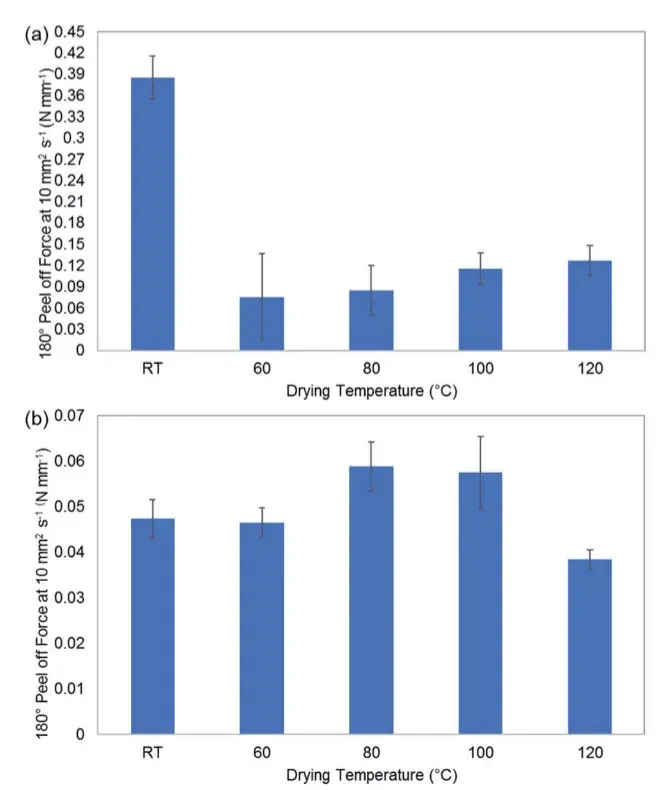
Figure 6. 180-degree peel strength for cathode (top) and anode (bottom) at different drying temperatures.
2.4 Standardized Pull-Off Adhesion Testing (Braunschweig, 2015)
Kwade’s team at TU Braunschweig published in International Journal of Adhesion and Adhesives the pull-off methodology that serves as the reference for nearly all peel testing today. They systematically studied contact pressure, dwell time, pull speed, and data acquisition rate to establish a standard procedure. Their findings: adhesion increases linearly with binder content, increases with binder molecular weight, and increases with slurry dispersion intensity.
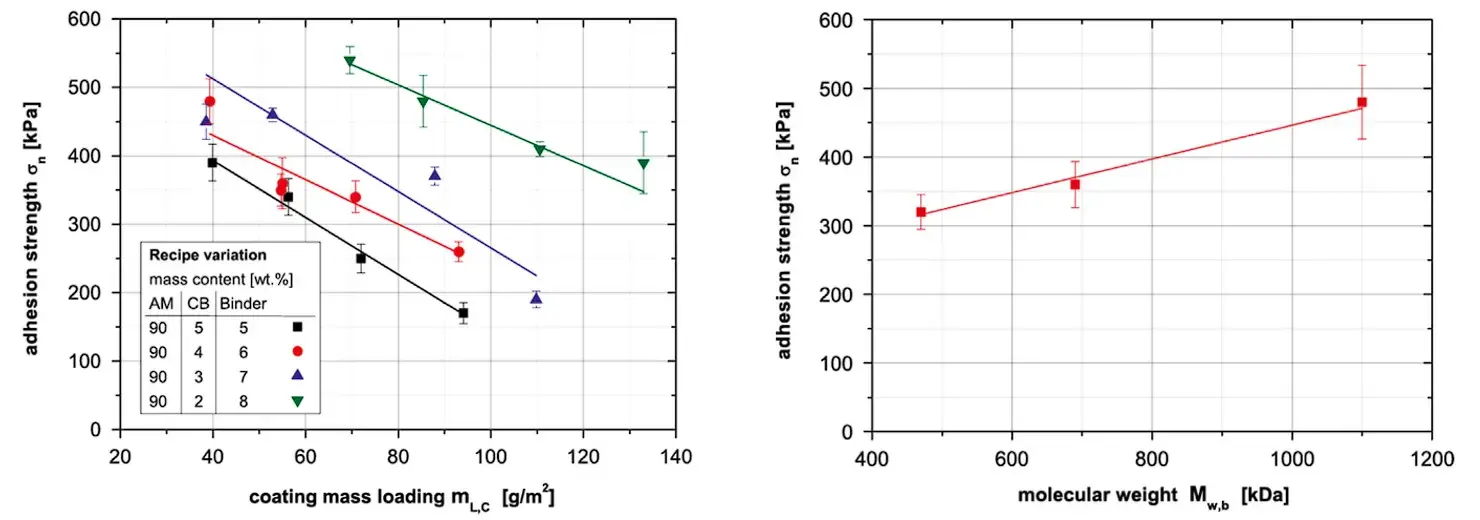
Figure 7. Adhesion strength vs. binder content/area density (left) and binder molecular weight (right).
3. Common Weaknesses of Academic Methods
No single technique resolves every level of the problem. Electron microscopy with chemical staining can reveal binder morphology at fine length scales, while Raman spectroscopy can estimate concentration gradients through the coating. X-ray CT and FIB-SEM-EDS can add three-dimensional or compositional context; peel and pull-off tests measure mechanical response. These methods are complementary because they observe different quantities and sample volumes.
But academic methods share three unavoidable limitations:
- Expensive equipment and high barriers to entry: Each instrument costs millions of RMB.
- Long testing cycles: Unable to close the loop on production lines.
- Complex sample preparation: Easily disturbs original structure; cannot quantify layer-by-layer differences.
More critically, these methods answer “why” — suitable for laboratory publications. Production lines need to answer “is this piece acceptable?” Academia examines mechanisms; industry examines consistency, dispersion, and process deviation.
There is also an overlooked gap: existing mechanical tests almost exclusively measure “overall” adhesion — pulling the entire coating off the copper foil to obtain an average value. They cannot characterize binder stratification or segregation.
4. IEST Industrial-Grade, Rapid, Layer-by-Layer Solutions
IEST Instrument has developed an “industrial-grade, rapid, layer-by-layer” solution for binder characterization. It does not pursue nanoscale film imaging under electron microscopes. Instead, it completes the “distribution → mechanics → electronics → electrochemistry” chain in minimal time on the production line.
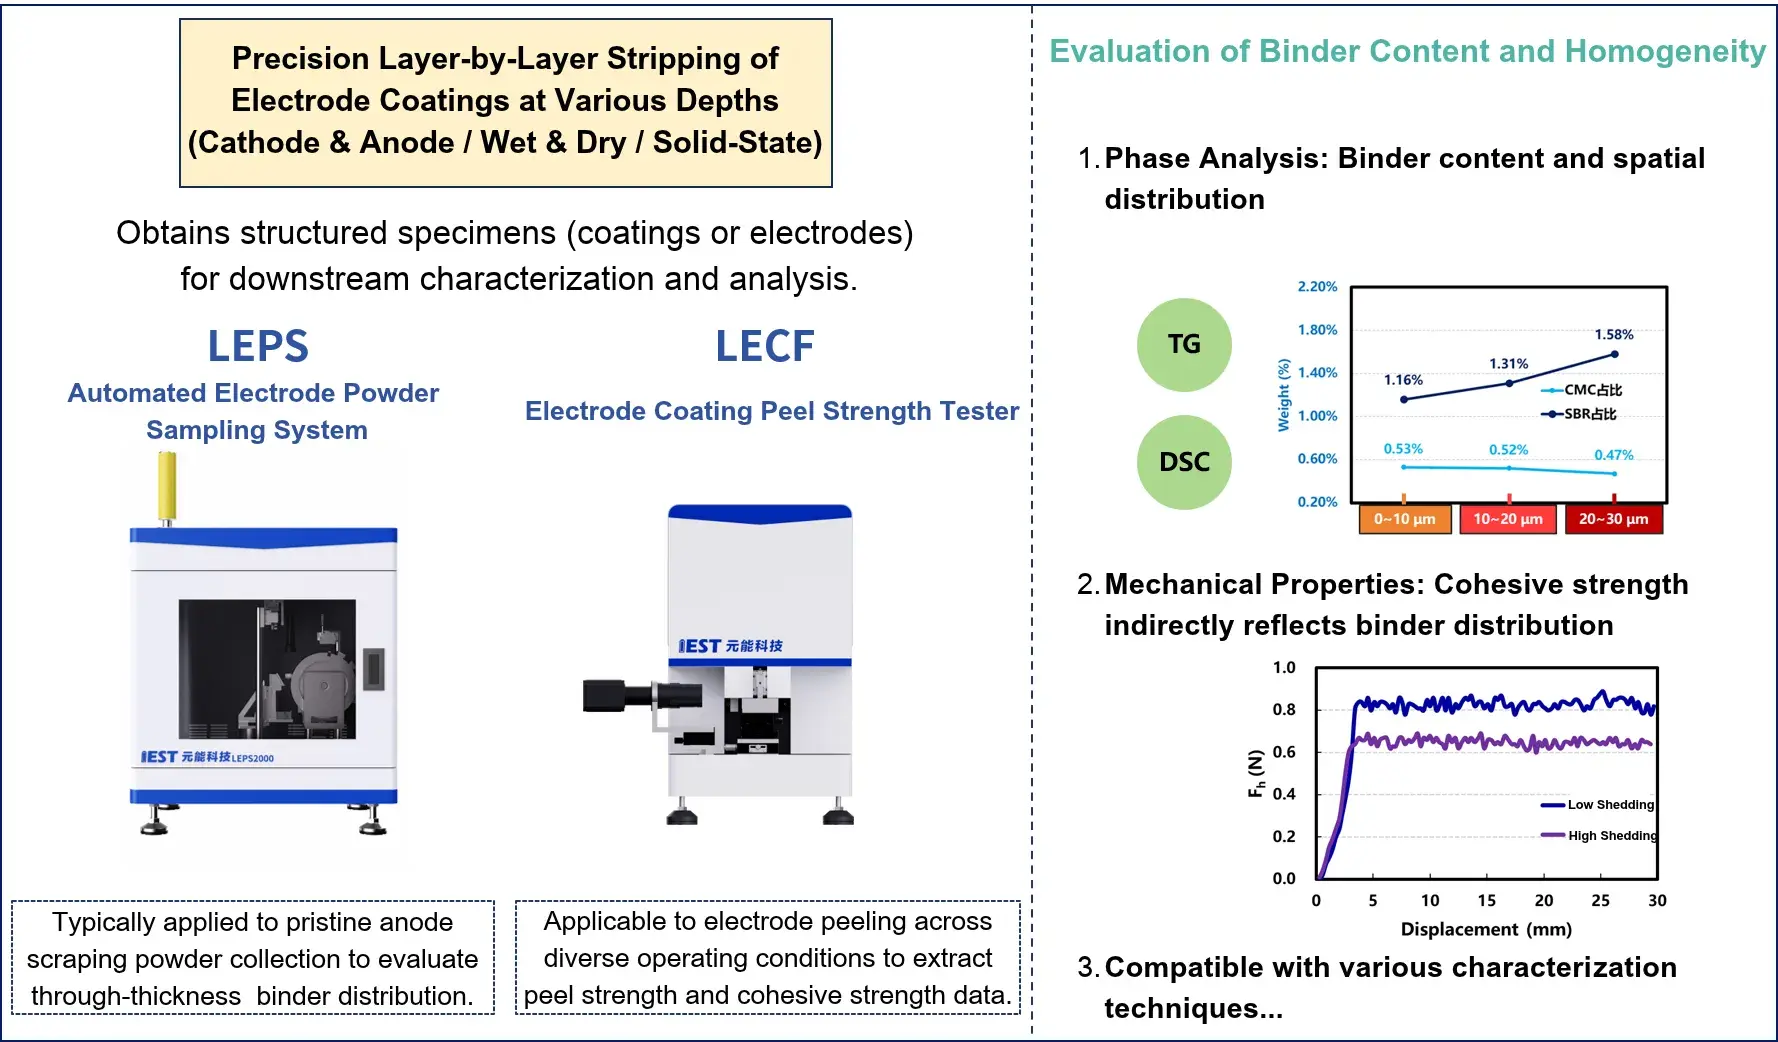
Figure 8. Binder layer-by-layer quantitative characterization solution — LEPS2000 (automatic electrode powder scraper) and LECF1000 (coating peel strength tester).
4.1 How Does LEPS2000 Support Depth-Resolved Binder Distribution Analysis?
IEST Instrument’s LEPS2000 Automated Electrode Powder Sampling System is designed to remove electrode coating material layer by layer from selected depths and locations. Rather than relying on freehand scraping, the system uses automated blade alignment, controlled scraping depth and non-contact closed-loop thickness measurement to improve sample preparation consistency.
For a binder-distribution investigation, the typical workflow is to collect separated powder fractions from defined coating depths and then quantify binder content or related composition using an appropriate downstream analytical technique. Depending on the question, the collected fractions can be assessed with thermogravimetric analysis (TGA), differential scanning calorimetry (DSC), SEM or X-ray diffraction (XRD). For CMC/SBR migration studies, TGA-based compositional comparison between layers can provide a practical complement to microscopy-derived spatial maps.
The equipment gives a scraping-depth control accuracy of 1 μm and describes pre- and post-scraping thickness verification. Those capabilities are relevant when the investigation requires comparable depth intervals across samples or batches.
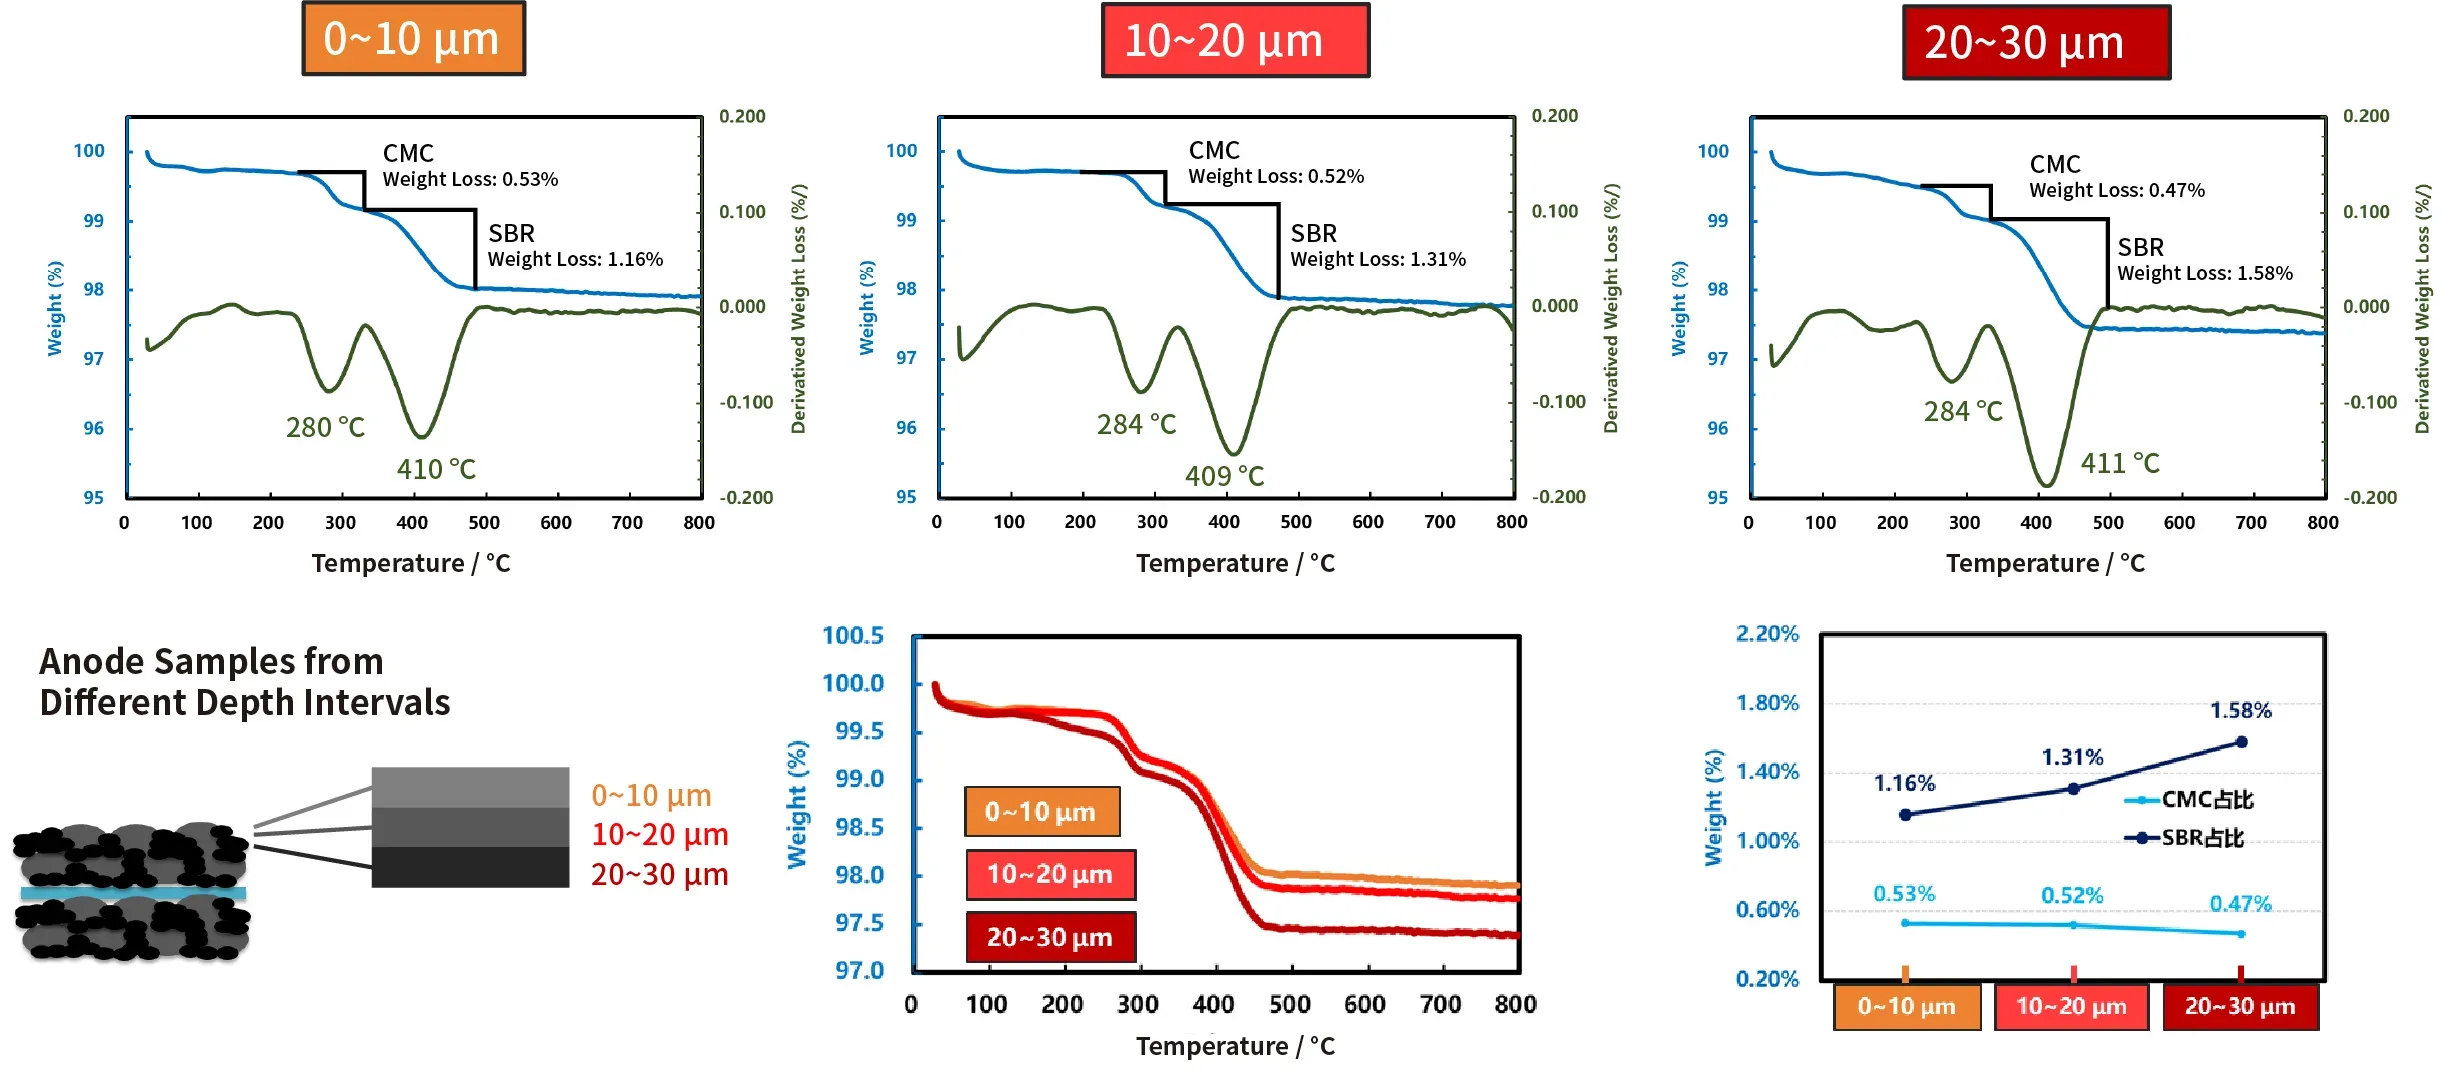
Figure 9. Application Case: CMC & SBR Content Analysis using LEPS2000 (automatic electrode powder scraper).
4.2 How Does LECF1000 Add Depth-Resolved Mechanical Information?
IEST Instrument’s LECF1000 Electrode Coating Peel Strength Tester addresses a related question: whether adhesion and cohesive strength vary with depth. The instrument controls how the blade enters the coating and then moves horizontally through the target layer while recording shear force. The measured response can be used to compare mechanical integrity at selected depths, rather than relying only on a single bulk peel-strength value.
That distinction matters when drying-induced migration creates a binder-rich surface and binder-lean region near the current collector, or when calendering fractures a surface film. A conventional 180° peel test may quantify the average response of the coating/current-collector interface, whereas a depth-resolved shear or peel-strength profile can help locate layers that respond differently under a controlled test.
The LECF1000 workflow can accommodate different electrode conditions, including disassembled wet electrodes and solid-state composite electrodes. It characterizes peel strength and cohesion at different depths. The tool precisely controls the cutter from the sample surface to the target depth, then slowly shears horizontally while recording real-time horizontal shear force.
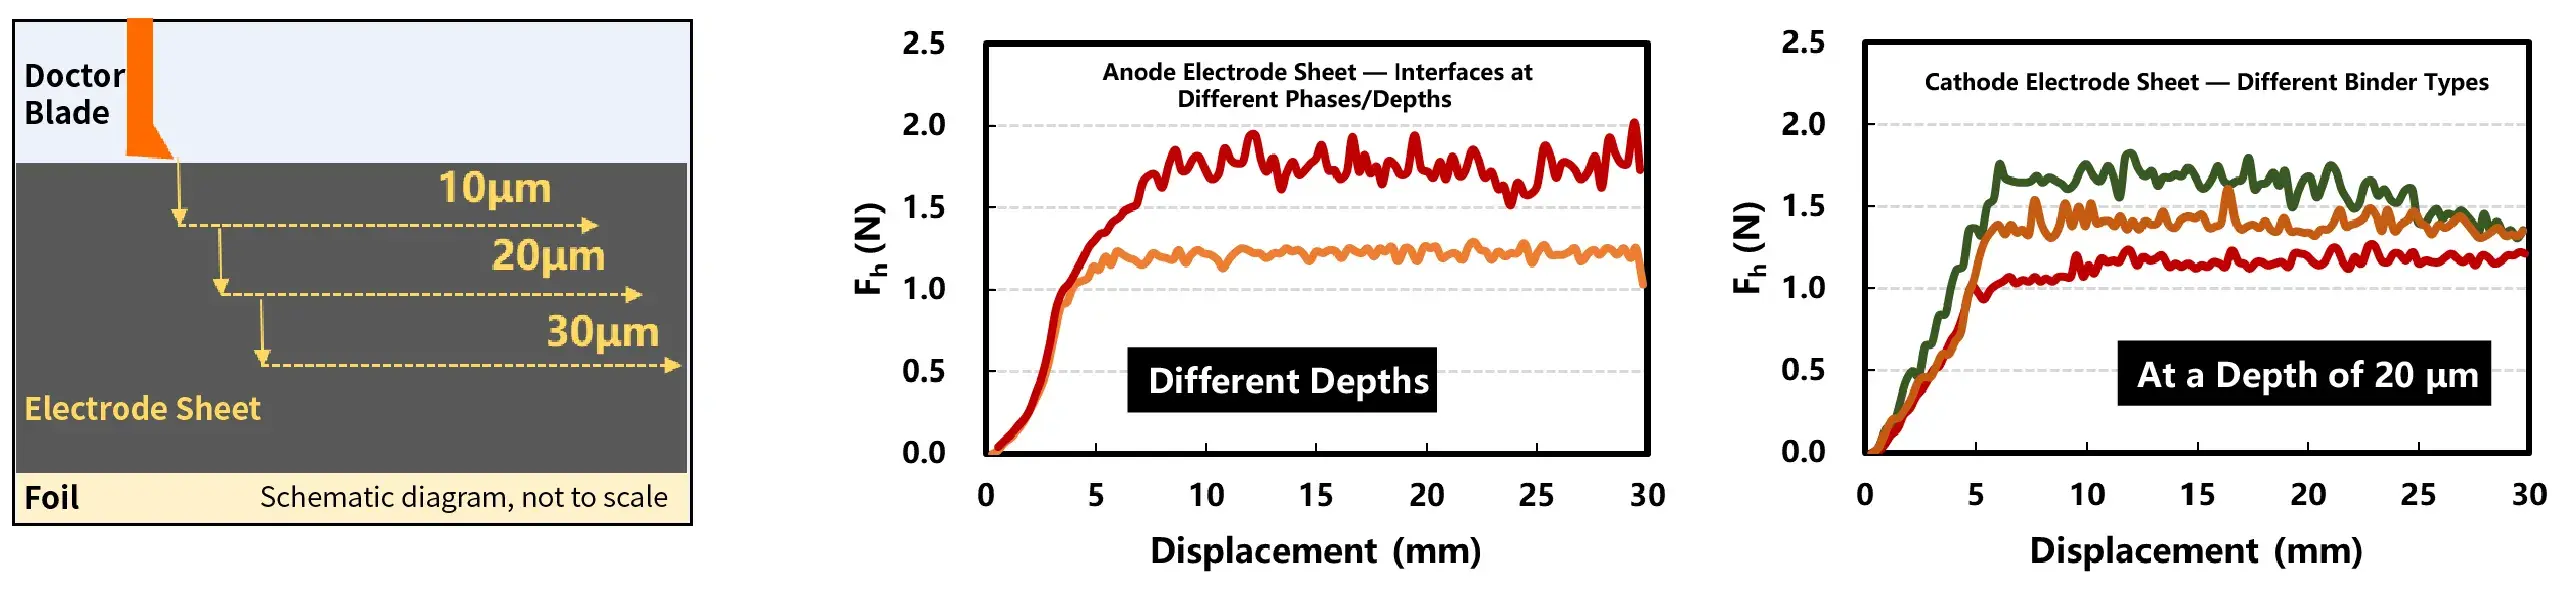
Figure 10. IEST LECF1000: Electrode Coating Peel Strength Testing Principle & Depth-Resolved Evaluation.
4.3 How Can Binder Distribution Be Linked to a Broader Electrode-Characterization Workflow?
Binder distribution is a starting point, not an isolated acceptance metric. To understand whether an observed gradient matters, engineers can pair depth-resolved sampling and mechanical testing with measurements of electrical resistance, ionic tortuosity, flexibility, swelling and cell-level electrochemical behavior. The goal is a linked set of measurements that can separate a composition issue from a conductivity issue, a mechanical issue or a cell-design issue.
| Question | Complementary measurement | IEST Instrument platform in the source workflow | What to compare |
|---|---|---|---|
| Is binder concentration uniform through the coating? | Layered powder sampling followed by TGA or another validated composition method | LEPS2000 | Binder/composition by depth and across sheet positions |
| Does local mechanical integrity change with depth? | Depth-specific shear force, peel force or cohesive-response comparison | LECF1000 | Force response by depth, position and process condition |
| Are electronic pathways sufficiently continuous? | Electrode resistance / resistivity characterization | BER Series electrode resistance tester | Resistance distribution and changes across process variants |
| Are ionic transport paths becoming more restrictive? | Electrode tortuosity characterization | EIC Series tortuosity tester | Through-pore path complexity and relative changes across conditions |
| Can the electrode withstand bending or winding? | Flexibility / mechanical integrity evaluation | BEF Series electrode flexibility system | Response under matched deformation conditions |
| Does the electrode maintain dimensional stability? | In-situ swelling or expansion analysis | SWE Series swelling analysis system | Expansion response under a defined electrochemical or mechanical condition |
| Do the structural indicators correlate with cell performance? | Cell charge/discharge testing | ERT Series electrochemical tester | Capacity, rate response and cycle-to-cycle consistency under a matched protocol |
Depth-Resolved Electrode Binder Characterization Workflow
Downstream analysis
TGA / DSC / SEM / XRD
Composition + morphology
By depth / position / batch
Correlate binder distribution with functional indicators
Electronic resistance · ionic tortuosity · flexibility · swelling · cell testing
Process validation and root-cause analysis
Use matched sampling locations, protocols and batch records; avoid unsupported universal thresholds
This solution follows the complete impact chain: binder distribution → layer-by-layer mechanics → electronic conduction → ionic tortuosity → swelling stability → electrochemical consistency. It is designed for process scenarios and requires no complex sample preparation.
5. Conclusion: From Academic Insight to Industrial Action
Returning to the Oxford paper’s other data point: simply adjusting the slurry dispersion process — pre-dispersing CMC and carbon black at higher concentration before diluting to final formulation — reduced binder agglomerate density from 8.5 to 0.4 per square millimeter, directly lowering electronic resistivity by 14%.
For too long, fine binder analysis has remained a laboratory mechanism research tool. High-precision characterization methods come with high equipment costs, complex sample preparation, and long testing cycles — difficult to match production line needs for rapid judgment, batch sampling, and closed-loop control.
Yet binder is genuinely the hidden skeleton of electrode performance: less than 5% by mass and volume, yet determining mechanical structural integrity, electronic and ionic transport uniformity, and ultimately electrochemical cycling stability. Subtle distribution deviations, amplified by manufacturing and cycling, evolve into significant performance dispersion.
IEST Instrument’s LEPS2000 and LECF1000 systems, combined with BER, EIC, and BEF series instruments, provide battery manufacturers with an industrial-grade solution for binder distribution characterization — bridging the gap between academic insight and production-line action.
This study offers mechanistic insight into how inter-particle phase coupling and local environment engineering can stabilize oxygen-redox chemistry in Li-rich cathodes, providing a scalable electrode-design paradigm for developing high-energy-density, long-life Li-rich cathode materials.
⚡ Need to investigate binder migration or depth-dependent electrode strength?
IEST Instrument’s layered characterization workflow combines controlled electrode powder sampling with depth-resolved coating mechanics. Select the sampling and testing route around your material system, suspected failure mode and required depth resolution.
6. References
[1] Zankowski, S. P. et al. “Chemical staining for fundamental studies and optimization of binders in Li-ion battery negative electrodes.” Nature Communications 17, 1438 (2026).
[2] Zhang, Y. S. et al. “Applications of advanced metrology for understanding the effects of drying temperature in the lithium-ion battery electrode manufacturing process.” Journal of Materials Chemistry A 10, 10593–10603 (2022).
[3] Müller, M. et al. “Investigation of binder distribution in graphite anodes for lithium-ion batteries.” Journal of Power Sources 340, 1–5 (2017).
[4] Hagiwara, H., Suszynski, W. J. and Francis, L. F. “A Raman spectroscopic method to find binder distribution in electrodes during drying.” Journal of Coatings Technology and Research 11(1), 11–17 (2014).
[5] Haselrieder, W. et al. “Measuring the coating adhesion strength of electrodes for lithium-ion batteries.” International Journal of Adhesion and Adhesives 60, 1–8 (2015).
7. FAQs
7.1 What is binder distribution in a battery electrode?
Binder distribution describes how binder concentration and morphology vary across electrode thickness, across the sheet and around active-material particles. It matters because the same average binder content can conceal local weak points, pore blockage or uneven conductive-carbon networks.
7.2 What is the effect of calendering on binder film coverage?
Calendering significantly reduces binder film coverage on active material surfaces. Research shows CMC coverage on graphite anodes drops from approximately 92% before calendering to about 32% after calendering — the binder film shatters into fragments covering less than one-third of the surface. This creates mechanical weak points that can initiate micro-cracks during cycling.
7.3 What is the relationship between binder uniformity and cycle life?
Binder uniformity directly correlates with cycle life. Non-uniform binder distribution creates spatial heterogeneity in mechanical strength and transport properties, leading to localized mechanical failure, electrochemical deactivation, and cascading regional pulverization. This is particularly pronounced in silicon-based anodes where ~300% volume expansion repeatedly amplifies mechanical heterogeneity.
7.4 How to detect binder anomalies in battery electrodes?
Binder anomalies can be detected through layer-by-layer scraping followed by thermogravimetric analysis to quantify binder content at each depth, peel strength testing to evaluate cohesion and adhesion, and electrode resistance measurements to identify transport non-uniformity. The IEST LEPS2000 and LECF1000 systems provide automated, high-precision detection suitable for both laboratory and production-line use.
7.5 How can I measure through-thickness SBR binder migration in a battery electrode?
Research workflows include calibrated Raman depth profiling or chemical staining followed by electron imaging and EDX. For production-oriented comparative analysis, LEPS2000 can collect coating powder from defined depths for a suitable downstream composition method such as TGA, while the depth intervals and sampling locations should be held consistent across batches.
7.6 How does binder migration during electrode drying affect battery performance?
During drying, binder can migrate toward the electrode surface, creating concentration gradients. Under 150°C strong convection drying, SBR concentration at the surface can reach nearly 3× that of the bottom layer within 30 seconds. This non-uniform distribution leads to mechanical heterogeneity, electronic conductivity variations, and ultimately accelerated capacity fade during cycling.
