

In lithium-ion battery electrode formulations, conductive additives account for only 1–3 wt% of the total solid content—far less than the >90 wt% of active materials. Yet this seemingly minor fraction directly determines fast-charging capability, cycle life consistency, and low-temperature power delivery.
With the industry pushing toward high-energy-density designs featuring thick electrodes and high compaction densities, the role of conductive additives has become more demanding. Many R&D teams rely solely on powder specifications and half-cell coin data for additive selection, only to encounter production-scale issues such as insufficient electrolyte wetting, internal resistance drift, and poor cell-to-cell consistency. This article systematically reviews characterization methods across powder, slurry, electrode, and cell levels, providing a practical reference for conductive additive selection, incoming inspection, and failure analysis.
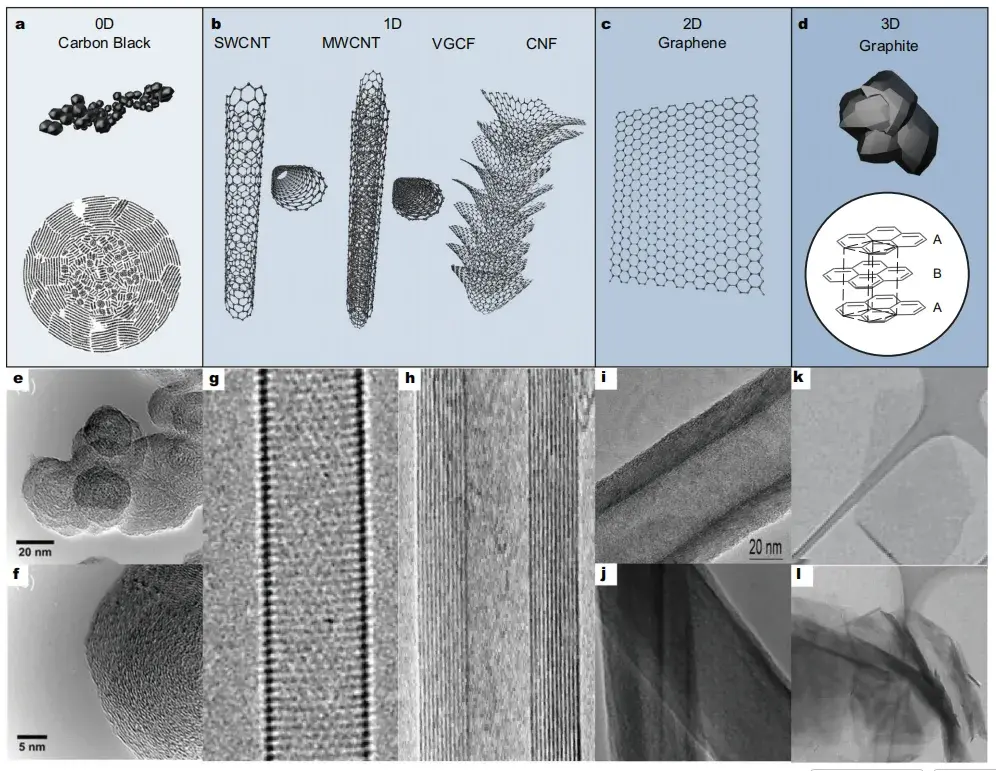
Figure 1. Morphological diversity of conductive additives: carbon black (spherical aggregates), carbon nanotubes (tubular networks), and graphene (2D sheet structures).[1]
Current lithium-ion battery conductive additives fall into four categories: carbon black, carbon nanotubes (CNT), graphene, and multi-component composite systems. Their fundamental differences lie in structure and conduction mechanism:
| Conductive Additive Type | Dimension | Typical Dosage | Key Advantages | Main Limitations |
|---|---|---|---|---|
| Conductive Carbon Black (Super P, Ketjenblack, etc.) |
0D (Particle) | 3%–10% | Low cost, mature process, easy dispersion | Low conductive efficiency, high loading requirement, compromises energy density |
| Carbon Nanotubes (CNT) | 1D (Fiber) | 0.5%–1.5% | High aspect ratio, strong bridging effect, ultra-low loading | Difficult to disperse, high slurry viscosity, demanding equipment requirements |
| Graphene | 2D (Nanosheet) | 0.3%–1.0% | Superior planar contact conductivity, improves electrode flexibility and compaction density | Prone to restacking and agglomeration, poor through-plane conductivity, higher cost |
| Multi-Dimensional Hybrid Systems | 0D + 1D + 2D | 0.5%–1.2% | Point-line-plane synergy, comprehensive conductive network, optimal overall performance | Complex formulation design, challenging quality control |
Effective conductive additive evaluation requires a systematic approach spanning four levels:
Powder compaction resistivity is the most fundamental and important indicator for conductive additives. The test method involves placing the conductive powder in a die and applying variable pressure while simultaneously recording resistivity and compaction density curves.
Why variable pressure? Different conductive additives exhibit distinct compaction behaviors:
A single resistivity value at one pressure therefore provides limited information. The pressure–resistivity curve shows how a conductive material transitions from a weakly connected powder bed to a more continuous electronic-conduction network. The accompanying compressed-density curve reveals whether the electrical change is driven primarily by densification and contact formation.
Using IEST Instrument’s powder resistivity analyzer, engineers can obtain quantitative pressure-resistivity profiles that directly inform compaction process parameters and additive loading optimization.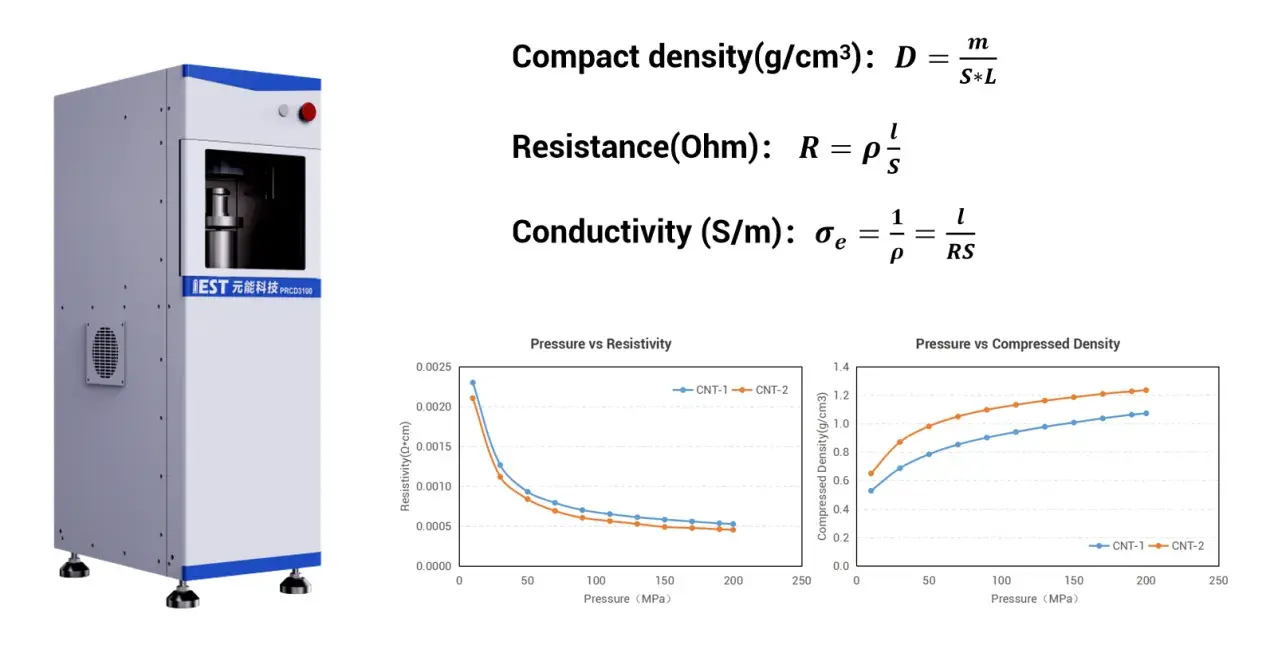
Figure 2. Powder resistivity & compaction density responses of conductive carbon under increasing pressure, demonstrating why pressure-dependent powder characterization is required for conductive additive selection.
Powder testing does not reveal whether a conductive additive remains uniformly dispersed after it is introduced into a slurry. The source describes a three-level electrode configuration that monitors resistivity near the top, middle, and bottom of the slurry.
A characteristic pattern is particularly informative: if the bottom-region resistance decreases rapidly while the top-region resistance increases, conductive particles are likely sedimenting toward the bottom. Such vertical separation indicates poor slurry stability. If the bottom-layer resistance rises rapidly while top-layer resistance increases correspondingly, it indicates conductive particles are settling—a sign of poor slurry stability.
Slurry with high sedimentation tendency leads to:
This measurement enables early detection of formulation or mixing process issues before coating.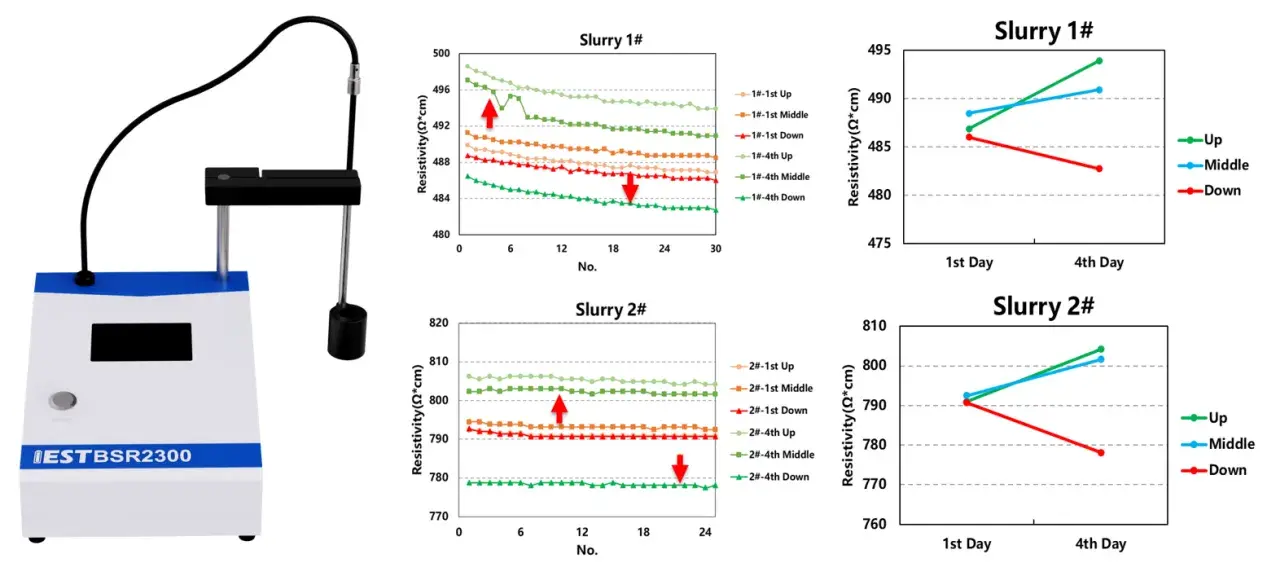
Figure 3. Multi-height slurry resistivity vs. time measured with a three-layer electrode fixture; bottom-layer resistance changes indicate sedimentation of conductive particles.
Conductive-additive dispersion is influenced by formulation, mixing conditions, coating parameters, drying conditions, and downstream processing. Because these parameters interact, poor conductive dispersion may not be obvious from electrode appearance or adhesion strength.
Measuring electrode resistivity at multiple positions and across different production batches adds a quantitative process-control layer. The objective is not simply to identify a low-resistance electrode, but to detect abnormal variation that may indicate upstream dispersion or coating instability.
This is particularly relevant for high-loading or thick electrodes, where a small change in conductive-network distribution can become more significant as electronic and ionic transport paths lengthen.
IEST Instrument’s electrode resistance testing system enables rapid, high-resolution spatial mapping of sheet resistance across the electrode surface. Monitoring resistance variations across different batches or positions can quickly identify:
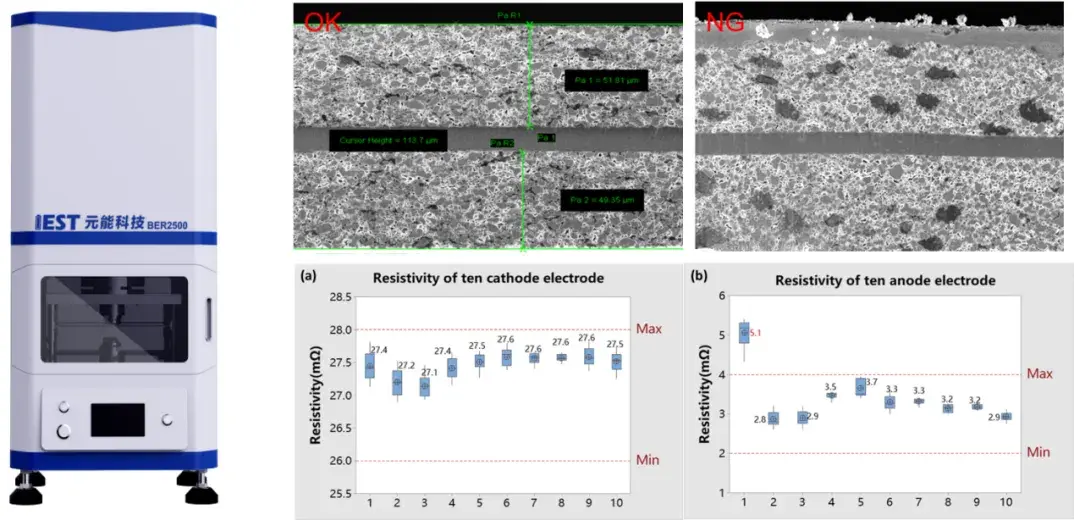
Figure 4. Multi-position electrode resistivity measurements, demonstrating how electrical-resistance mapping can reveal dispersion and coating-uniformity differences that are not visible from electrode appearance alone.
Tortuosity (τ) represents the degree to which pore pathways deviate from straight-line diffusion. High tortuosity impedes electrolyte infiltration and Li⁺ ion migration, directly reducing rate capability. High-surface-area nano-carbon can improve electronic connectivity, but excessive conductive additive may occupy or constrict the open pores between active-material particles.
This article identifies two related mechanisms:
As a result, an additive formulation optimized only for electronic conductivity may impose a penalty on electrolyte access and ion migration. This is why electrode tortuosity should be considered together with resistivity rather than treated as an unrelated property.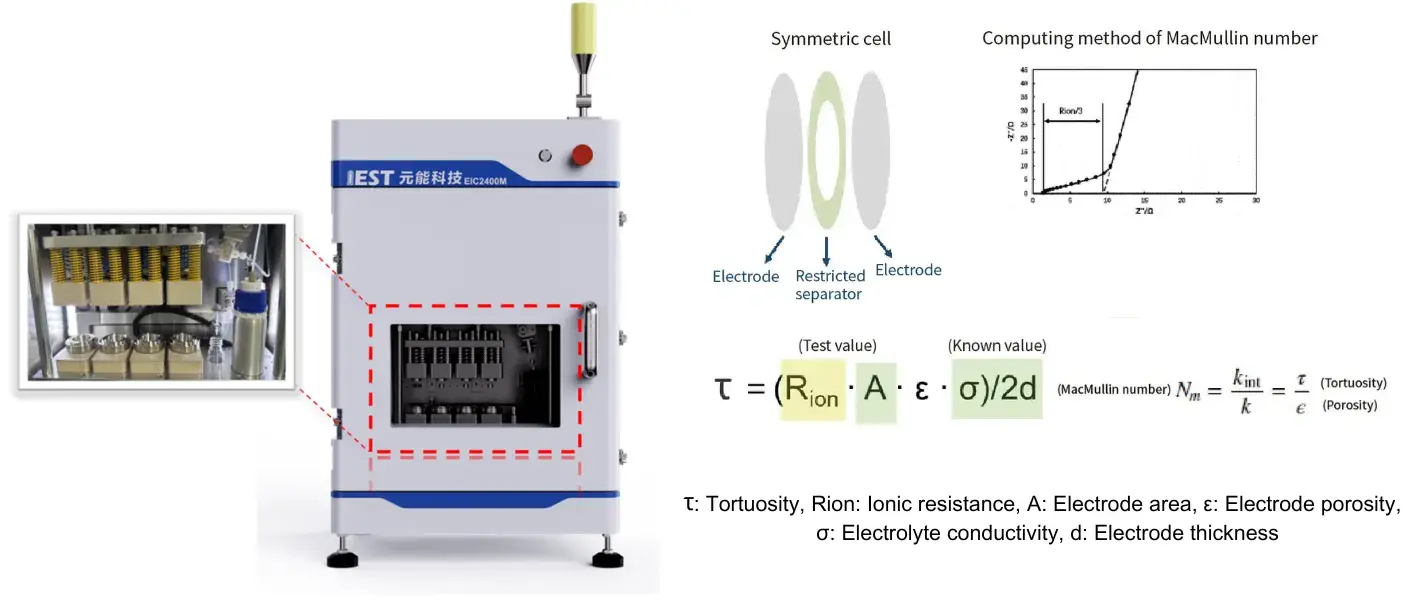
Figure 5. Electrode tortuosity characterization, illustrating the relationship between pore-path geometry, electrolyte percolation, and ion-transport resistance.
Well-dispersed conductive additives can create carbon-rich interfaces while preserving a hierarchical pore structure. Large pores facilitate relatively rapid electrolyte penetration, whereas smaller pores contribute to liquid retention.
Excess conductive carbon can produce a large nominal surface area while simultaneously creating a high fraction of nanoscale pores. Strong capillary forces may then retain electrolyte within these small pores and slow penetration toward deeper regions of a cell.
For high-loading electrodes, wetting measurements therefore provide information that powder resistivity cannot. A formulation can exhibit favorable electronic conductivity while still presenting an electrolyte-access problem that delays formation or creates local electrochemical non-uniformity.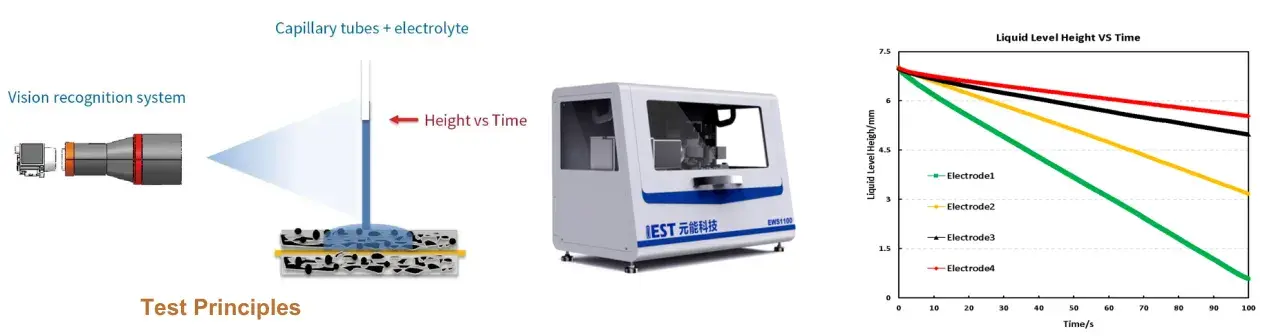
Figure 6. IEST Electrode Electrolyte Wetting Testing System for quantifying electrolyte contact angle and dynamic infiltration behavior.
High-surface-area conductive carbon can introduce additional sites where electrolyte decomposition occurs. The source article links this behavior to continued formation and growth of the solid electrolyte interphase (SEI) at carbon surfaces during cycling.
As cycling proceeds, the source reports simultaneous increases in RSEI and Rct. These resistance components provide a cell-level perspective that cannot be derived from powder resistivity alone. For conductive-additive optimization, EIS is therefore best interpreted as a downstream diagnostic: it can help determine whether a conductivity improvement is accompanied by increased interfacial reactions or impedance growth.
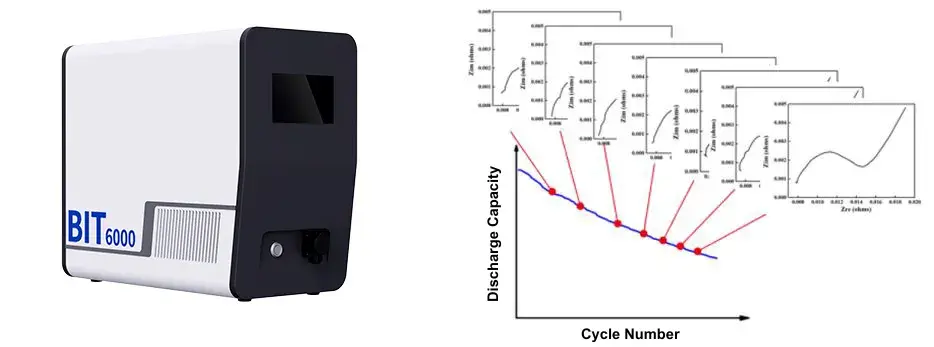
Figure 7. Real-time electrochemical impedance evolution and cyclic capacity degradation tracking using IEST BIT6000 Battery Impedance Tester.
In the reported coin-cell comparison, conductive-carbon contents of 0%, 1%, 1.5%, 2%, and 3% were tested across increasing C-rates up to 2.5C. Cells with less than 1% conductive carbon exhibited sharp capacity decline, retaining only about 2% capacity at 2.5C. Conversely, formulations with ≥1.5% conductive carbon maintained continuous electronic pathways, retaining >80% capacity.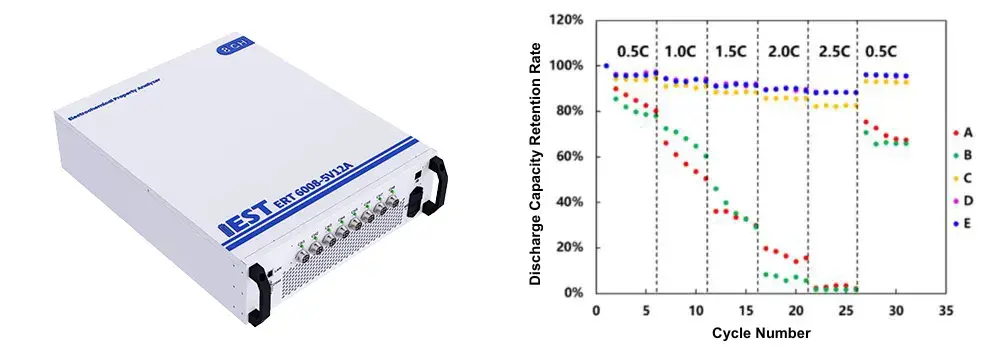
Figure 8. Rate-performance comparison for cells containing 0%, 1%, 1.5%, 2%, and 3% conductive carbon, showing the effect of conductive-additive content on capacity retention up to 2.5C.
A reliable conductive-additive screening strategy follows the material from powder to slurry, electrode, and cell. Each measurement answers a specific engineering question:
| Characterization Layer | Primary Variable | What the Test Reveals | Typical Failure Signal | Implication for Battery Design |
|---|---|---|---|---|
| Powder | Resistivity vs. pressure (Ω·cm at 20 MPa) | How conductive contacts form under compaction | High resistivity at relevant pressure or unstable response | Select conductive carbon based on its compaction-dependent network behavior rather than a single conductivity value |
| Slurry | Vertical resistivity distribution over time | Dispersion stability and conductive-particle sedimentation | Bottom resistance decreases while top resistance increases | Ensure uniform distribution before coating |
| Electrode | Spatial resistance variation (%) | Electrical-network uniformity after coating and drying | Large position-to-position or batch-to-batch resistance variation | Use resistance mapping for process control and consistency screening |
| Electrode transport | Tortuosity (τ) | Geometric resistance to electrolyte and ion transport | Increased path complexity or blocked pore connectivity | Avoid optimizing electronic conductivity at the expense of ionic transport |
| Electrolyte access | Wetting / liquid penetration behavior | How rapidly electrolyte accesses the porous electrode | Slow penetration toward deeper electrode or cell regions | Balance surface area, pore size distribution, and conductive-carbon loading |
| Cell electrochemistry | EIS, rate capability | Interfacial impedance and usable capacity under higher current | RSEI/Rct growth or sharp capacity loss at high C-rate | Confirm that material-level improvements translate into cell-level performance |
Conductive additives occupy only a small fraction of a lithium-ion electrode formulation, but their structural and electrical role can strongly influence battery rate capability, process consistency, and electrochemical stability. The reported coin-cell results show a pronounced effect of conductive-carbon content: below 1% loading, discharge capacity at 2.5C fell to approximately 2%, while above 1.5% the reported capacity remained above 80%.
For development and manufacturing, conductive-additive selection should therefore combine powder resistivity testing with slurry, electrode, transport, wetting, EIS, and rate-performance measurements. The resulting multi-scale workflow allows engineers to distinguish an intrinsic material limitation from a dispersion or process problem and to identify the trade-off between electronic conduction and ionic accessibility.
Evaluate conductive carbon from powder compaction and resistivity through slurry stability, electrode uniformity, wetting, tortuosity, impedance, and rate capability. IEST Instrument provides battery-material characterization platforms for connecting formulation variables with measurable electrode and cell behavior.
[1] Baumgärtner, J. F.; Kravchyk, K. V.; Kovalenko, M. V. Navigating the Carbon Maze: A Roadmap to Effective Carbon Conductive Networks for Lithium-Ion Batteries. Adv. Energy Mater. 2024, DOI:10.1002/aenm.202400499.
[2] Yuan, P., Ding, X., Guo, P., et al. Research and industrialization of conductive additive technology in the field of new energy batteries. Process Engineering Journal, 2023, 23(8):1118-1130. DOI:10.12034/j.issn.1009-606X.223115.
Industry practice typically requires 1.5–2.0 wt% conductive carbon for rate capability ≥80% at 2.5C. Below 1%, capacity retention drops below 2% at 2.5C; above 3%, energy density penalty and pore blocking outweigh benefits.
Carbon black provides point-to-point contact and is cost-effective but requires higher loading. CNT offers line-to-line long-range conduction with lower loading but needs careful dispersion. Graphene provides plane-to-plane high conductivity but faces restacking and cost challenges. Composite systems often deliver synergistic performance.
Selecting conductive additives for thick electrodes depends on electronic conductivity needs and ionic transport preservation. IEST Instrument’s characterization portfolio—including powder resistivity, slurry stability, electrode resistance mapping, and tortuosity measurement—enables engineers to quantify both electronic and ionic performance trade-offs for informed selection.
Fine conductive carbon can occupy or block interconnected pores, increasing tortuosity and slowing electrolyte transport. Excess high-surface-area carbon can also retain electrolyte in small pores and delay penetration into deeper regions of a porous electrode.
A robust workflow should include pressure-dependent powder resistivity, slurry resistivity, electrode resistivity, tortuosity, wetting, EIS, and rate capability. The combined results show whether a conductive carbon improves electronic transport without creating dispersion, ionic-transport, or interfacial penalties.
