

Lithium-ion battery ageing involves coupled failure modes spanning materials, interfacial electrochemistry, electrode structure, and manufacturing processes. A single performance anomaly — capacity drop, impedance spike, or swelling — is rarely traceable to one isolated cause. The same symptom can originate from lithium plating, SEI thickening, particle cracking, or coating delamination, making root cause identification a persistent industry bottleneck.
Extensive review literature has consolidated battery aging into three core degradation modes: loss of cyclable lithium inventory (LLI), loss of active material (LAM) at either electrode, and internal resistance growth. These modes manifest macroscopically as capacity fade, DCIR rise, gas evolution, lithium plating, and — in extreme cases — thermal runaway. However, because these mechanisms are coupled and often occur simultaneously, assigning a single root cause requires a structured, multi-dimensional analytical framework.
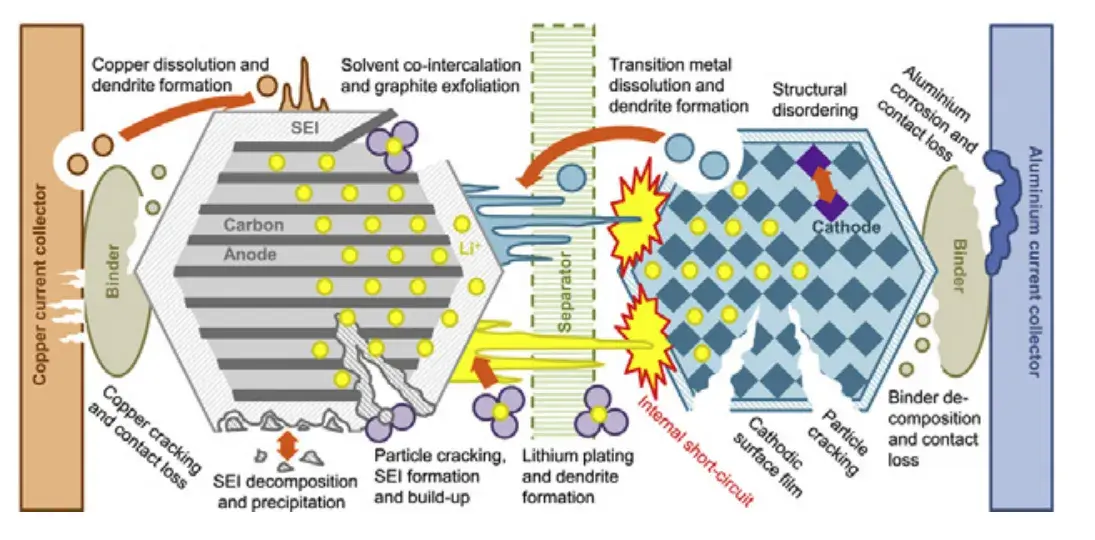
Figure 1. Schematic of lithium-ion battery ageing mechanisms, showing the interlinked pathways of active lithium loss (LLI), active material loss (LAM), and impedance growth that drive capacity fade.
Effective failure analysis follows three core principles:
IEST Instrument‘s seven-dimensional characterization portfolio provides the full toolkit to execute this workflow — covering cell-level mechanical behavior, interfacial electrochemical response, electrode-level electronic/ionic transport, and particle-level mechanical integrity.
Lithium Battery Failure Analysis Flowchart:
Using an in-situ swelling analyzer(SWE Series), a 2 Ah NCM/Si pouch cell at 100% SOH shows stable swelling amplitude and excellent springback during cycling. By contrast, the same cell aged to 80% SOH exhibits significantly larger irreversible deformation and delayed discharge rebound. Over long-term cycling, this cumulative irreversible deformation progressively damages the electrode structure, tears the SEI film, and accelerates active material loss and lithium inventory depletion. These data directly support cell structure optimization and cycle-life improvement.
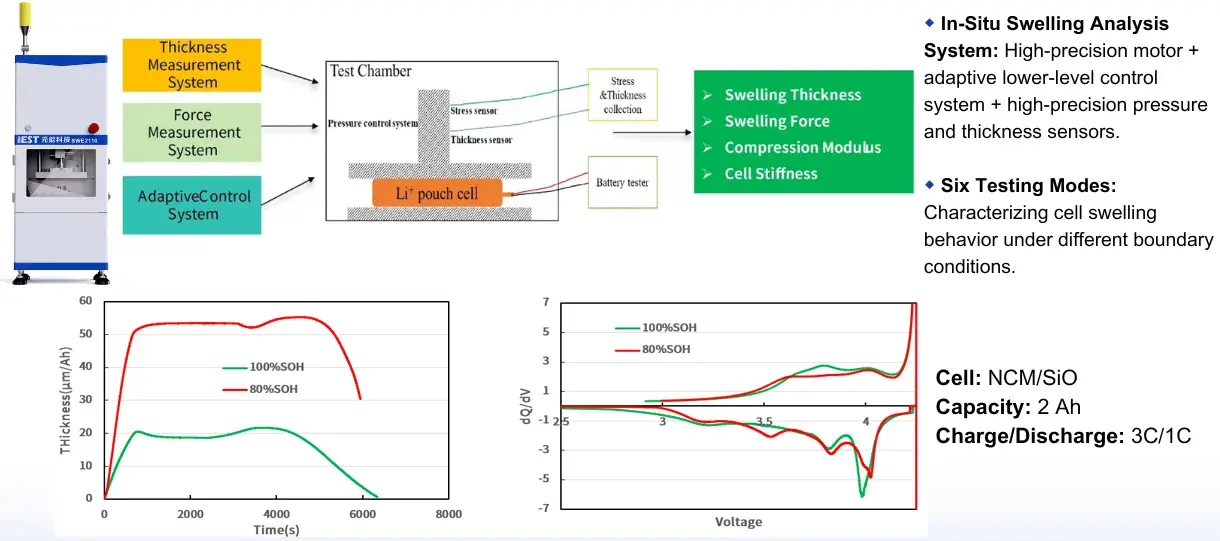
Figure 2. Differences in Swelling Behavior of Aged Cells.
EIS impedance decomposition separates the cell’s impedance spectrum into four distinct components:
This “one dataset, one fault class” capability enables rapid diagnosis of whether the root cause is materials, formation, or mechanical assembly.
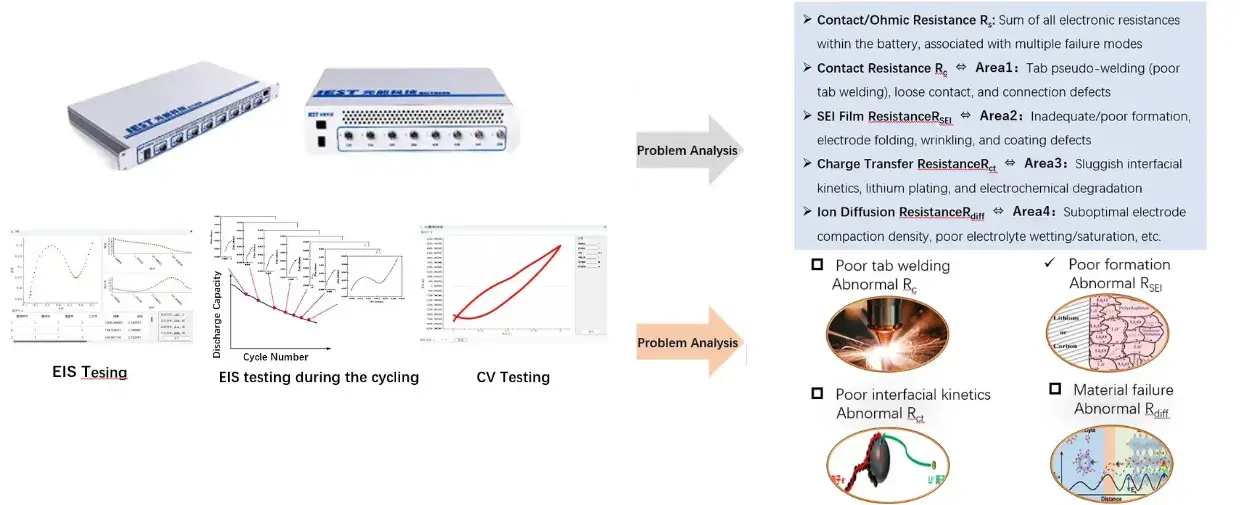
Figure 3. EIS impedance decomposition and fault correlation — each impedance component (\(R_s\), \(R_{SEI}\), \(R_{ct}\), \(R_{diff}\)) links to a distinct failure mechanism, enabling targeted root cause identification.
| EIS Component | Physical Meaning | Failure Mode Association | Diagnostic Indicator |
|---|---|---|---|
| Rs | Ohmic resistance (electrons + electrolyte) | Tab welding, contact, assembly defects | Sudden increase early in life |
| RSEI | SEI film resistance | Poor formation, electrode creasing, non-uniform SEI | Steady growth over cycling |
| Rct | Charge-transfer resistance | Lithium plating, low-T degradation, electrolyte dry-out | High initial value or rapid rise |
| Rdiff | Solid-state diffusion impedance | Excessive compaction, poor wetting, pore collapse | High value at low frequencies |
Electrode resistance measurements on fresh vs aged electrodes reveal a clear pattern: fresh dry electrodes show the lowest resistance and best uniformity. After aging, both cathode and anode resistances increase significantly — with the anode degrading far more severely than the cathode — and the coefficient of variation (COV) rises markedly, directly degrading cycling stability.
In parallel, separator ionic conductivity testing quantifies ion-transport efficiency across different separator types, identifying pore blockage, poor wetting, and material defects that contribute to poor rate capability and internal resistance fluctuations.
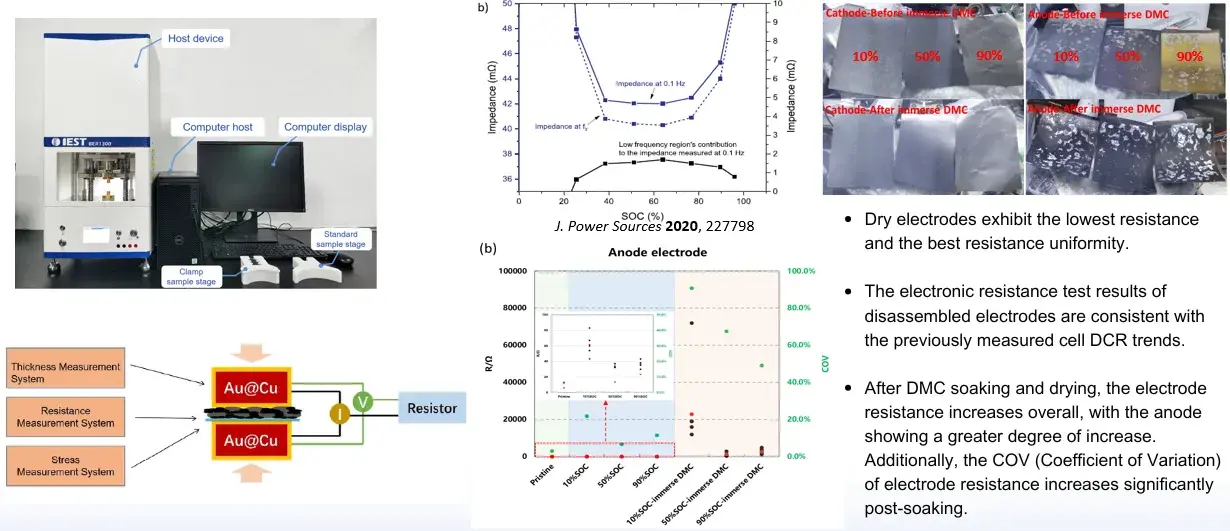
Figure 4. Resistance difference between cathode and anode electrode sheets.
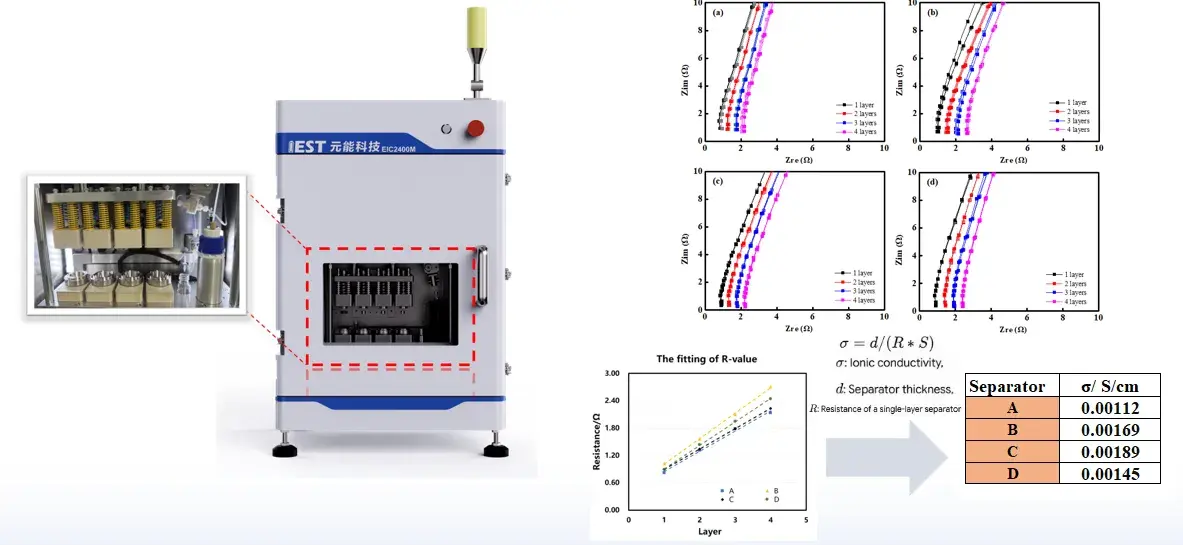
Figure 5. Ionic conductivity comparison of different separators.
Electrode cohesion testing quantifies the internal strength of the electrode coating under different binder formulations, coating thicknesses, calendering conditions, and aging states. The method clearly distinguishes structural differences between cathode and anode electrodes, enabling diagnosis of coating delamination, particle shedding, and binder failure caused by improper binder selection, non-uniform coating thickness, or defective calendering. This data directly supports optimization of coating, calendering, and formulation processes.
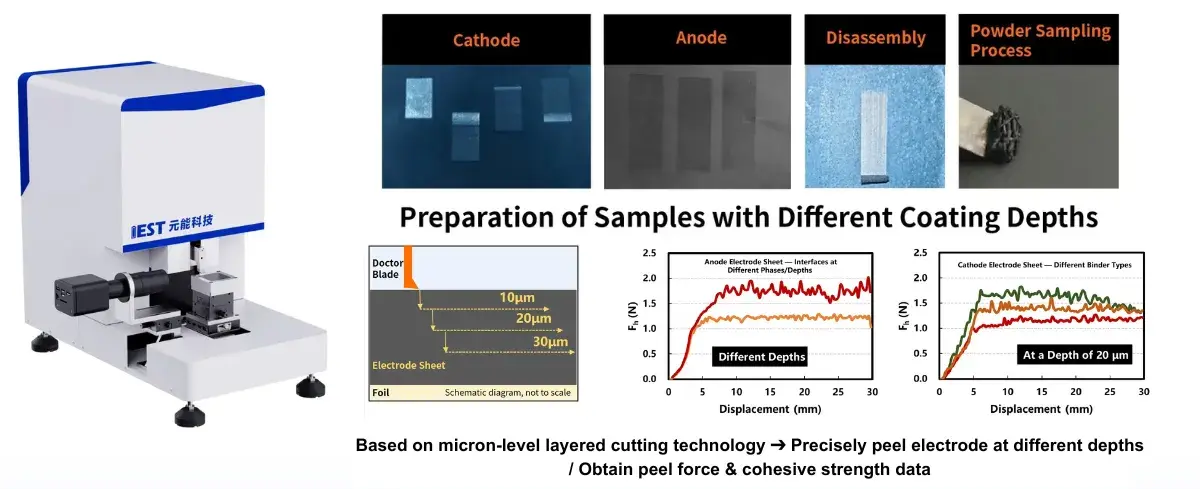
Figure 6. Cohesion data comparison between cathode and anode electrode sheets.
Single-particle crushing tests on high‑nickel NCM cathodes reveal a direct correlation between cycle number and particle strength: after 400 cycles, aged particles exhibit significantly lower crushing strength and fracture more easily. This explains the sudden capacity drop and continuous impedance rise observed in long‑cycle cells. The technique provides the core data needed for cathode material modification and system optimization.
Single-particle mechanical testing — A microscale compression method that measures the fracture force and crushing strength of individual battery particles (typically 5–20 µm). It directly links active-material mechanical integrity to cell-level cycling stability and is critical for understanding particle fracture as a root cause of capacity fade.
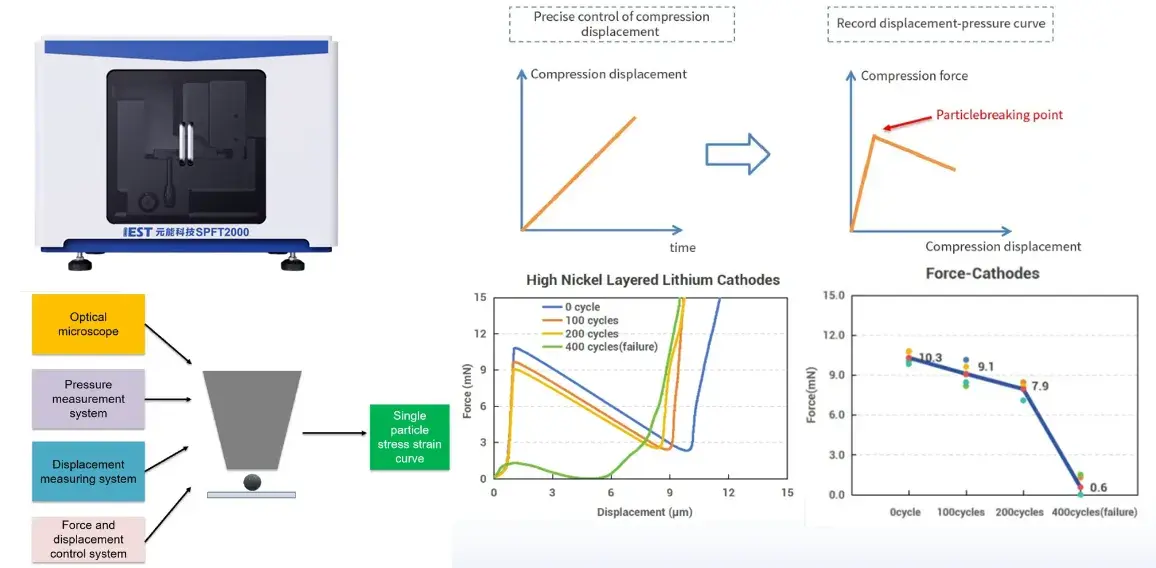
Figure 7. Correlation between cell SOH and single-particle crushing strength.
DCR decomposition independently quantifies the resistance contribution of six components: cathode, anode, separator, aluminum current collector, copper current collector, and tab welding points. Data show that the cathode contributes 41.22% of total cell resistance — the dominant factor — followed by the anode at 35.82%. This component-level breakdown pinpoints whether high internal resistance originates from intrinsic material properties, production assembly, or welding defects, solving the industry pain point of “knowing that resistance is high, but not knowing where.”
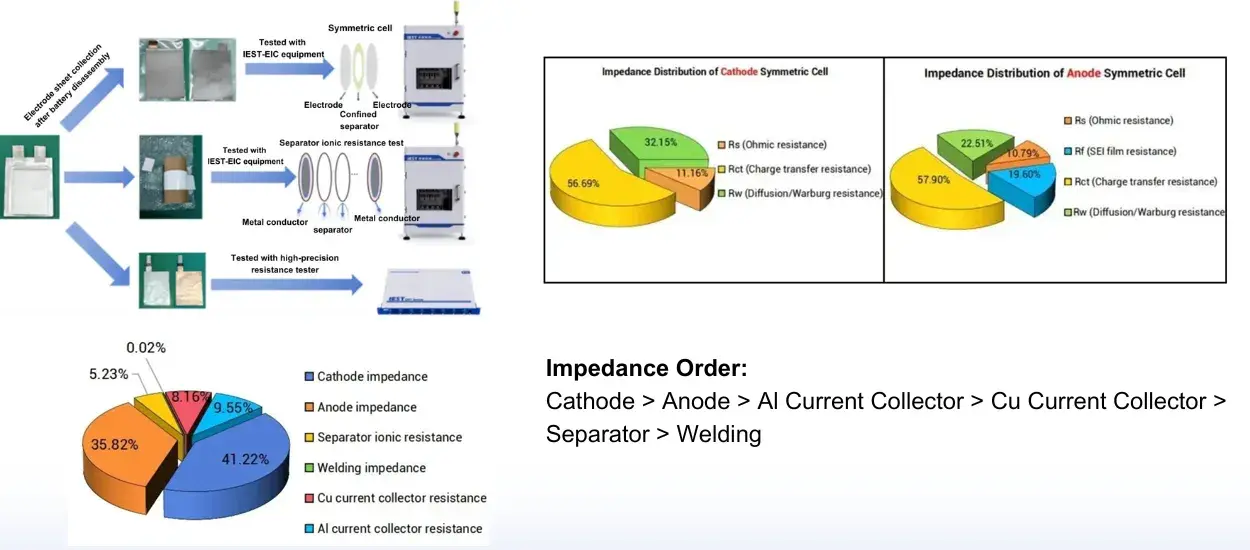
Figure 8. DCR component contribution breakdown.
To eliminate coincidental errors from single measurements, IEST’s reverse Automatic Coin Cell Assembly System(CAAS Series) punches electrodes from the failed cell and reassembles them with standard lithium foil, separator, and electrolyte. CT imaging verifies electrode flatness and assembly quality. By replicating the failed cell’s material system and structure, the method reproduces the failure and, together with healthy-cell reference testing, rules out assembly errors, environmental interference, and equipment faults — confirming whether the root cause is material-, process-, or structure-related.
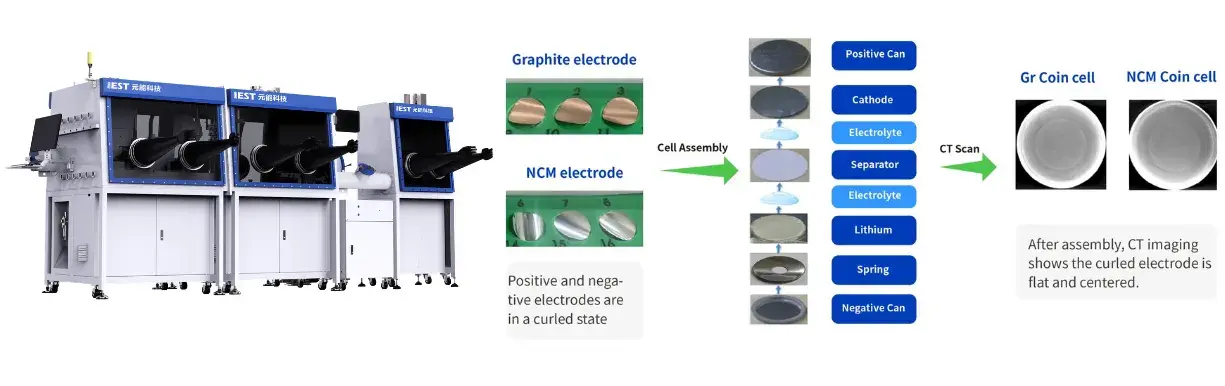
Figure 9. IEST Coin Cell Automatic Assembly System(CAAS Series).
From the perspective of lithium-ion battery ageing mechanisms, irreversible performance degradation in cells is primarily driven by the coupling of three core degradation modes:
These three degradation mechanisms do not occur independently, particle fracture accelerates SEI growth, which consumes active lithium, while lithium loss alters the operating potential of the electrode and accelerates material structural deterioration, creating a mutually reinforcing vicious cycle.
IEST Instryment comprehensive seven-dimensional characterization solution for lithium-ion batteries achieves multi-scale, full-coverage testing—ranging from macroscopic cell deformation and impedance separation to electrode interfaces and single-particle micromechanics. It effectively differentiates root causes such as lithium loss, active material failure, and process/assembly defects, solving the industry pain points of difficult failure traceability and lack of direction in rectification. This provides actionable technical support for battery R&D iteration, mass-production quality improvement, and safety risk prevention and control.
IEST Instrument’s seven-dimensional characterization suite — from in-situ expansion and EIS decomposition to single-particle testing and DCR full-component breakdown — gives you the complete toolkit to locate the root cause of capacity fade, impedance growth, and safety events in lithium-ion cells.
[1] Vetter J , Novák P , Wagner M R , et al. Ageing mechanisms in lithium‑ion batteries[J]. Journal of Power Sources, 2005,147(1‑2):269‑281.
[2] Birkl C R , Roberts M R , Mcturk E , et al. Degradation diagnostics for lithium ion cells[J]. Journal of Power Sources, 2017, 341:373‑386.
[3] Li D, Danilov D, Xie J, et al. Degradation Mechanisms of C₆/LiFePO₄ Batteries: Experimental Analyses of Calendar Aging[J]. Electrochimica Acta,2016,196:106‑116.
Lithium battery failure analysis is a systematic diagnostic process that identifies the root causes of performance degradation — including capacity fade, impedance rise, swelling, and safety events — by decomposing cell behavior into mechanical, electrochemical, and structural failure modes. It combines non-destructive screening with destructive characterization to isolate material, process, or assembly defects.
EIS impedance decomposition uses electrochemical impedance spectroscopy to separate a cell’s total impedance into frequency-dependent components — Rs, RSEI, Rct, Rdiff — each linked to a specific physical process. DCR decomposition, in contrast, measures DC resistance and isolates the contribution of each hardware component (cathode, anode, separator, current collectors, welding points). The two methods are complementary: EIS identifies the degradation mechanism, while DCR pinpoints the component responsible.
Selection depends on the failure symptom and the stage of investigation. Start with non-destructive techniques: visual inspection, CT, ultrasound, and in-situ EIS to screen for gross defects. Then move to destructive characterization: electrode resistance, cohesion, single-particle testing, and DCR decomposition to isolate material-intrinsic failure. IEST Instrument’s portfolio covers the full workflow, providing a unified approach for R&D, production QC, and field-failure analysis.
Industry practice typically targets a coefficient of variation (COV) below 5% for electrode resistance uniformity in production-quality electrodes. Values exceeding 5% indicate non-uniform conductive network distribution, which can lead to localized overpotential, lithium plating, and accelerated degradation. Fresh electrodes often achieve COV below 3%, while aged electrodes may show COV exceeding 10%.
Single-particle crushing strength directly correlates with active-material integrity during cycling. As particles lose mechanical strength — through crack propagation, grain boundary failure, or repeated lithiation stress — they fracture, exposing fresh surfaces that consume electrolyte and lithium inventory. This accelerates SEI growth and capacity fade. Quantifying particle strength provides early warning of mechanical degradation before cell-level performance drops, enabling proactive material or process optimization.
