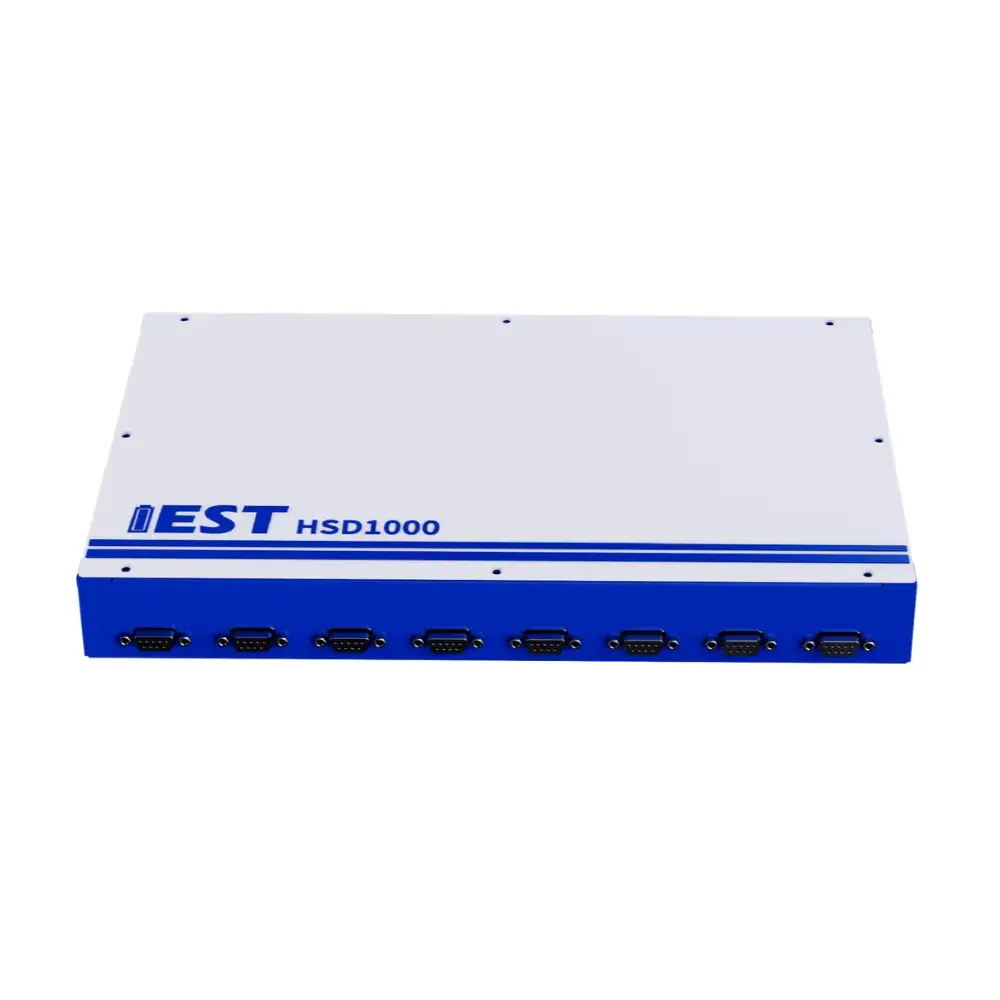
Description
1. Sources of Battery Self-Discharge
Self-discharge is a phenomenon where a battery experiences natural capacity loss during storage, typically manifesting as an open-circuit voltage (OCV) drop over time. Self-discharge in lithium-ion batteries is generally classified into physical self-discharge and chemical self-discharge based on the underlying reaction mechanism.
1.1 Physical Self-Discharge
Physical self-discharge refers to self-discharge behavior induced by physical causes. It is commonly driven by internal micro-short circuits within the cell. For example, the presence of loose powder particles or current collector burrs generated during electrode slitting can pierce the separator, causing direct contact between the cathode and anode, thereby initiating micro-short circuits and physical self-discharge.
1.2 Chemical Self-Discharge
Chemical self-discharge refers to capacity loss resulting from spontaneous internal chemical reactions. Primary causes of chemical self-discharge include:
-
Irreversible reactions between the cathode and electrolyte, occurring predominantly in materials prone to structural defects, such as lithium manganate and lithium cobaltate;
-
Continuous dissolution, degradation, and repair of the solid electrolyte interphase (SEI) layer on the anode, which consumes substantial active lithium and leads to chemical self-discharge and capacity loss;
-
Irreversible chemical reactions triggered by intrinsic impurities present within the electrolyte;
-
Irreversible reactions involving metallic impurities and the electrolyte, such as transition metal impurities in the cathode dissolving and depositing onto the anode, which eventually pierce the separator.
2. Significance of Battery Self-Discharge Testing
2.1 Calendar Aging Evaluation
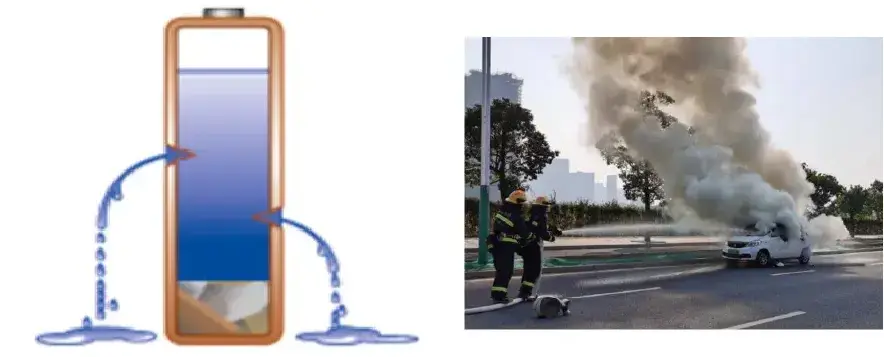
Battery degradation stems partly from material and electrolyte consumption caused by side reactions during cycling, and significantly from spontaneous capacity loss during shelf storage (calendar aging). Self-discharge (leakage current) testing serves as a crucial metric for evaluating this spontaneous capacity loss and predicting calendar life.
2.2 Consistency Evaluation
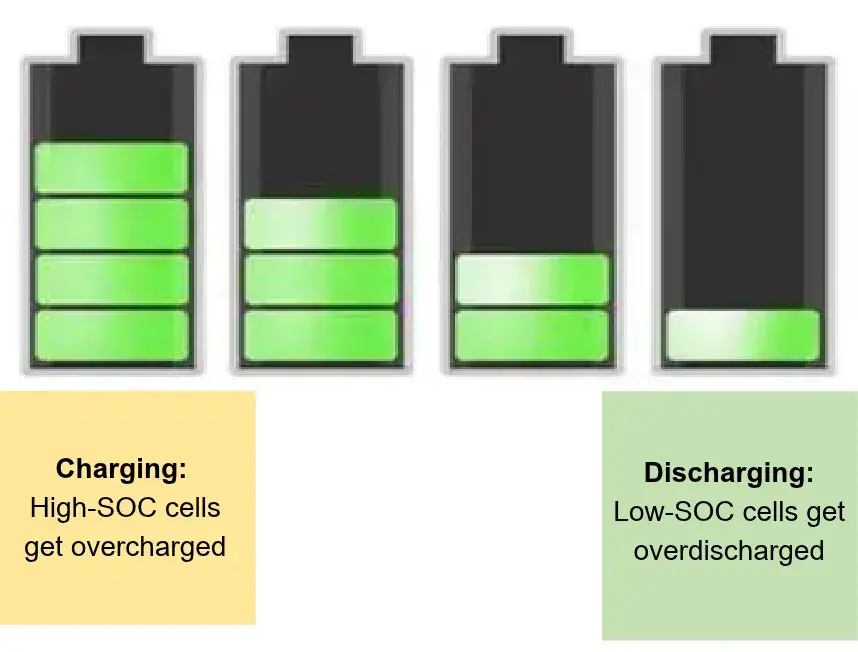
Assembling series-connected battery modules using cells with inconsistent self-discharge rates (leakage currents) leads to progressive SOC divergence. This imbalance causes individual cells in the module to undergo overcharging or overdischarging, leading to irreversible cell damage. As charge-discharge cycles accumulate, this degradation worsens, drastically reducing the single-cell cycle life and potentially triggering thermal runaway and safety hazards. Therefore, precise self-discharge evaluation is an essential requirement in battery module manufacturing.
2.3 Accelerating Advanced Material R&D
Chemical self-discharge can originate from the dissolution and plating of transition metals and impurities from the cathode onto the anode, which pierces the separator and induces micro-short circuits. It can also stem from the rupture and repair of the anode SEI layer, or the corrosion of active material surfaces by the electrolyte or impurities. Extending calendar life requires continuous optimization of cathode and anode materials, electrolyte formulations, and additive systems, thereby driving the development of next-generation cells that balance high energy density with prolonged storage life.

3. Features
- High-Resolution Metrology: 16-bit DAC and 24-bit ADC with 1μV voltage resolution and 30nA current resolution.
- Exceptional Stability: Voltage fluctuation stays within 10μV (12h test) and 20μV (7-day test).
- Comprehensive Analysis: Effectively identifies physical (micro-shorts) and chemical (SEI degradation, electrolyte reactions) self-discharge sources.
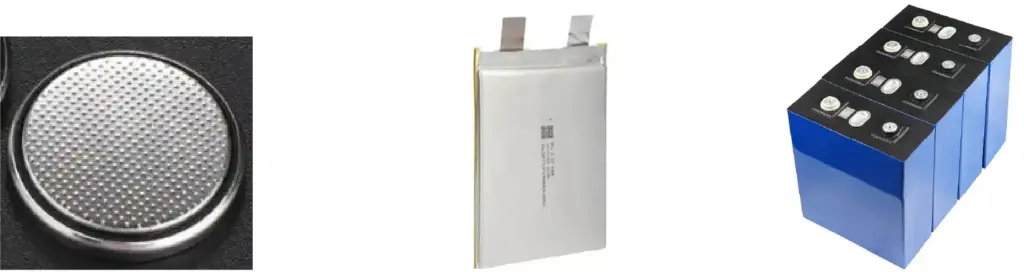
- Broad Cell Compatibility: 8-channel testing with automatic resistance gear switching, supporting coin, pouch, prismatic, and energy storage cells.
Applications
1. High-Precision Potentiostatic Method for Long-Term Response Current Monitoring and Self-Discharge Evaluation
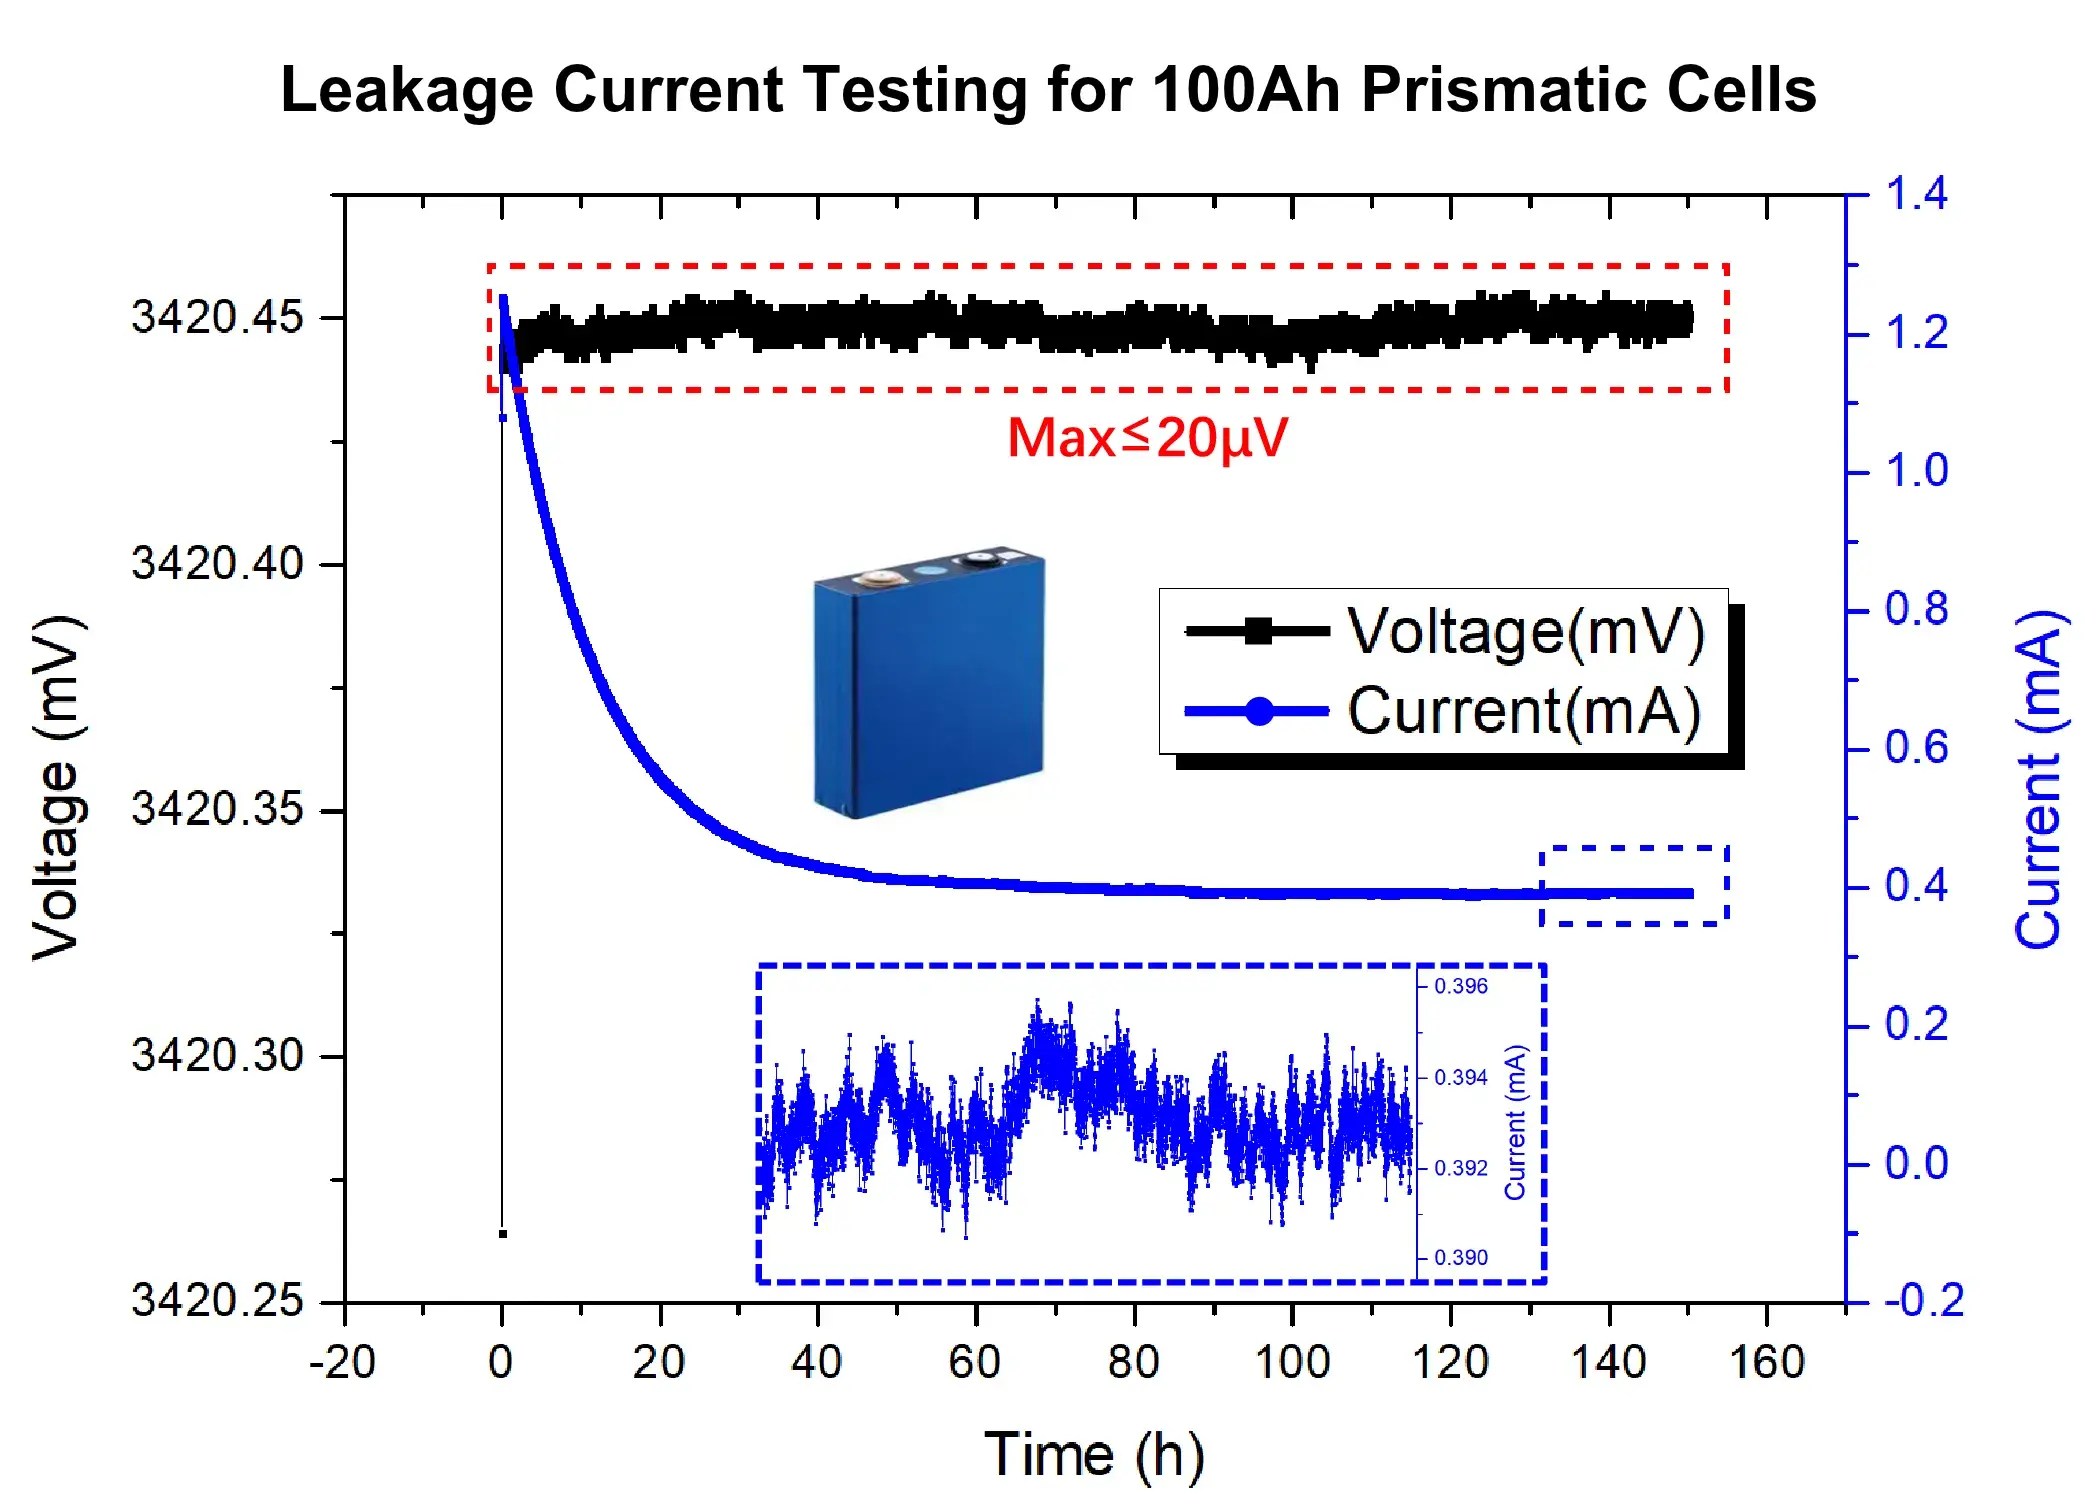
High Precision: Equipped with a 16-bit DAC and 24-bit ADC, achieving a voltage resolution down to 1 μV with a minimum readable current of 30 nA.
High Stability:
- Short-term (12 h) test: Voltage fluctuation peak-to-peak range is stably controlled within 10 μV.
- Long-term (7 days) test: Voltage fluctuation peak-to-peak range is stably controlled within 20 μV.
Broad Adaptability: Supports automatic switching between internal resistance ranges, enabling testing across diverse battery formats from Coin Cells → Pouch Cells → Power Batteries → Energy Storage Cells (ESS).
2. Comparison of Battery Leakage Current Across Different SOC States
Under identical environmental conditions (holding material chemistry, ambient temperature, and SOH constant), cells stored at a high SOC feature a lithium-rich anode. This state promotes the formation of electron-ion-electrolyte complexes, exacerbating self-discharge and accelerating capacity degradation.
Experimental Conditions: Two 100Ah prismatic power battery cells were selected, adjusted to 20% SOC and 100% SOC respectively, and subjected to a 7-day potentiostatic test at 40°C to compare their leakage current levels.
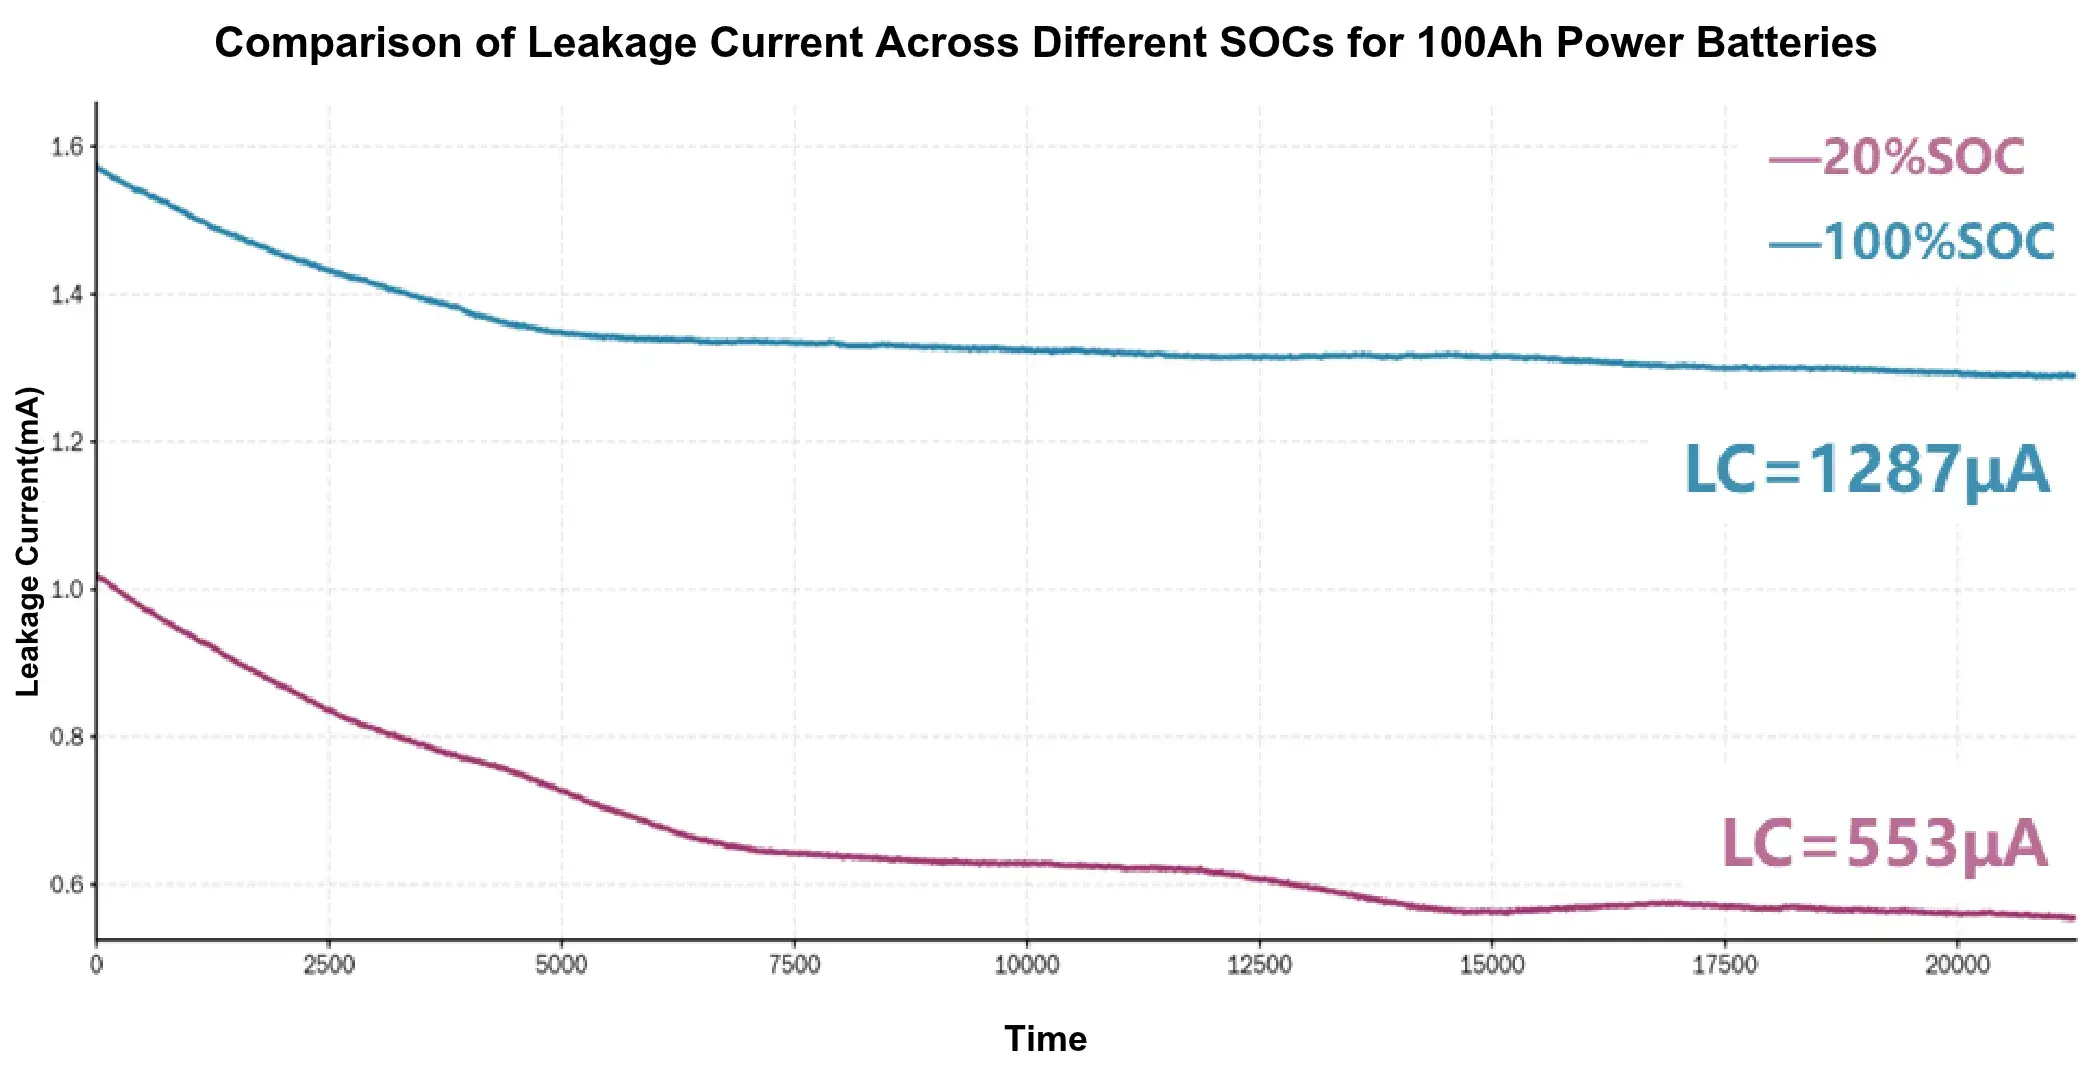
Cells at higher SOC exhibit larger leakage currents (LC100% SOC > LC20% SOC).
3. Comparison of Battery Leakage Current Across Different Temperatures
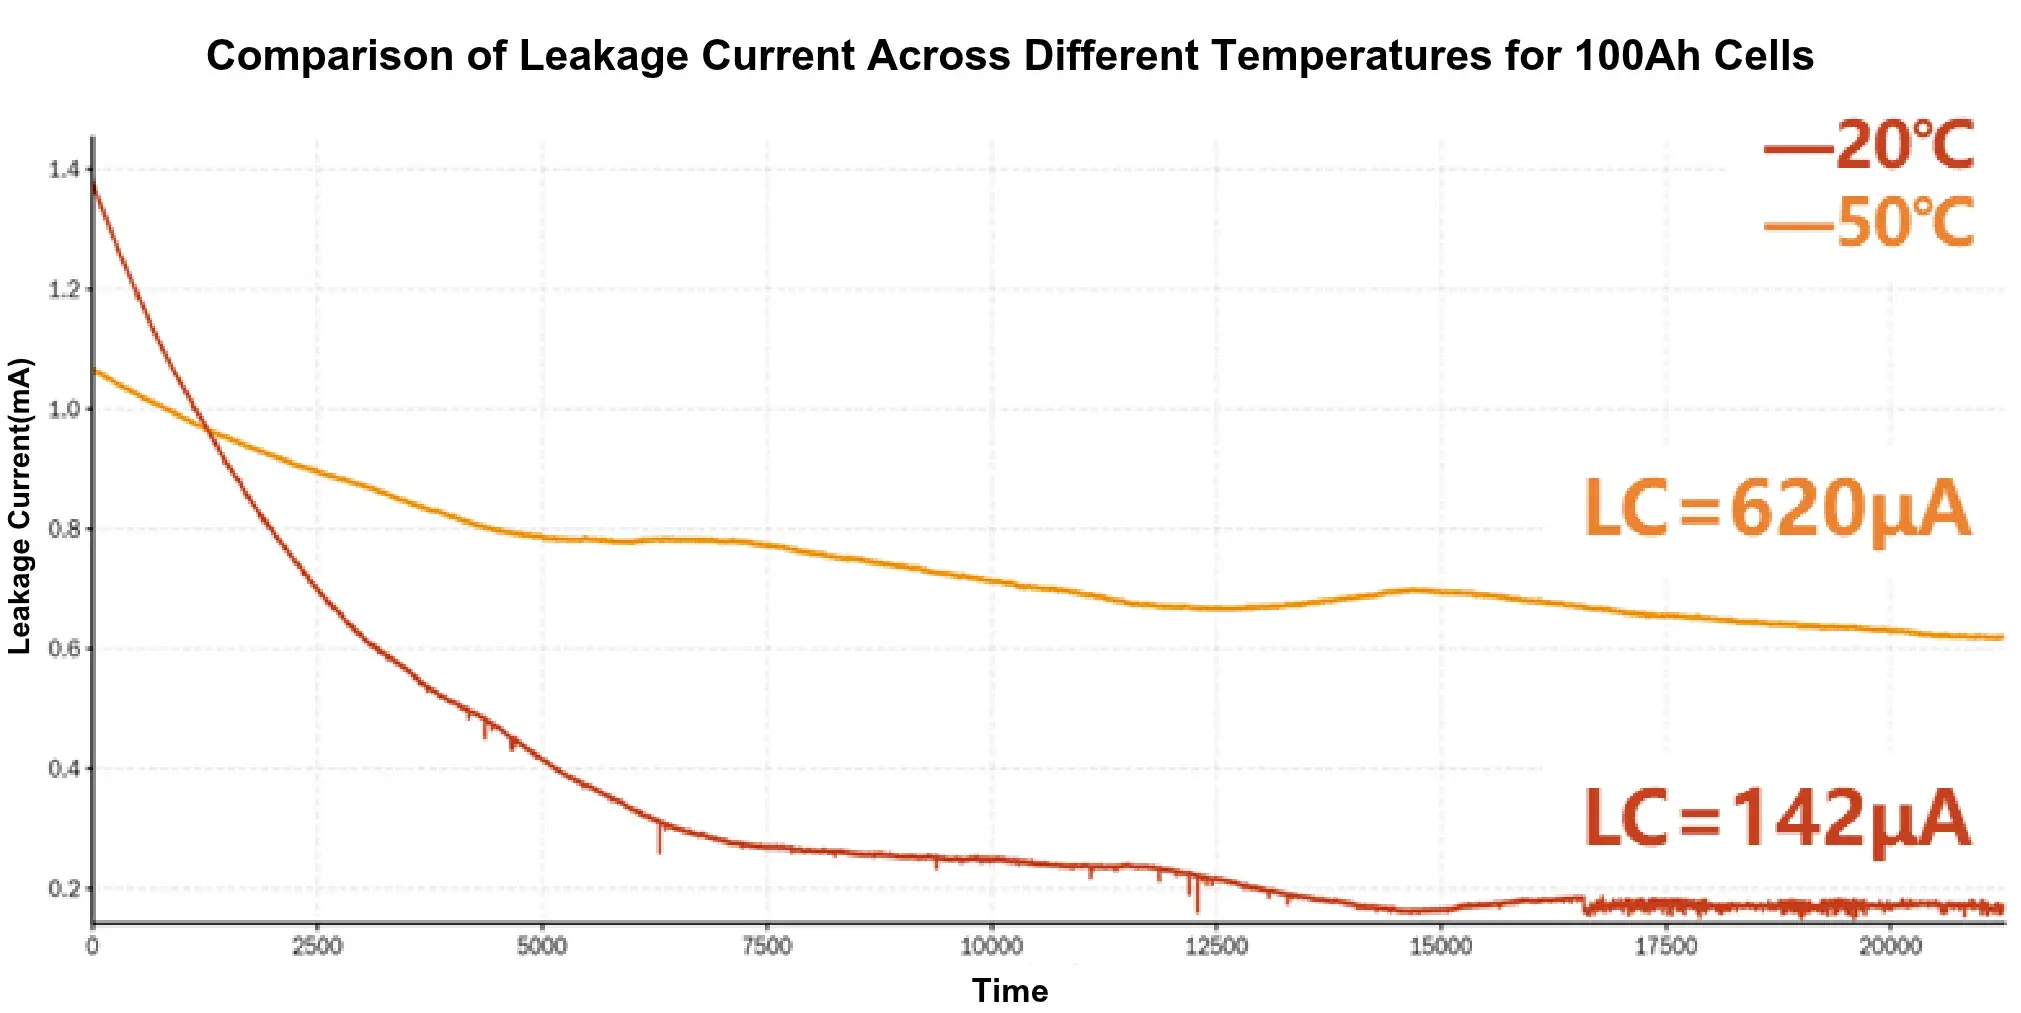
Temperature significantly affects battery self-discharge. At elevated temperatures, the stability of the solid electrolyte interphase (SEI) layer degrades, accelerating SEI breakdown and repair processes while continuously consuming active lithium ions. Furthermore, higher temperatures increase transition metal dissolution from the cathode, enhance electron mobility, and boost electrolyte reactivity. These coupled factors intensify side reactions between electrode active materials and the electrolyte, resulting in elevated leakage currents at high temperatures.
Experimental Conditions: Two 100Ah prismatic power battery cells were selected and placed at 20°C and 50°C, respectively. After a 1-day rest period to ensure thermal equilibrium throughout the cells, a 7-day potentiostatic test was conducted to compare their leakage current levels.
Specifications
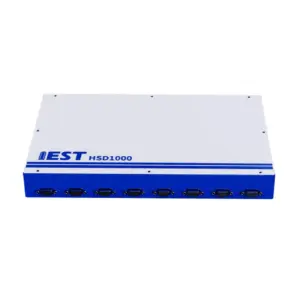
| Model | HSD1000 |
|---|---|
| Channels | 8 |
| Voltage Range | 0 ~ 5V |
| Voltage Accuracy | 0.04% F.S. |
| Voltage Resolution (24-bit) | 1 μV |
| CV Stability (Voltage Fluctuation) | Within 10 μV (12 h, ±0.3°C); Within 20 μV (7 days, ±0.3°C) |
| Current Range | 10 mA ~ 1 mA; 1 mA ~ 100 μA; 100 μA ~ 30 nA (Auto 3-range switching) |
| Current Accuracy | 3% |
| Selectable Series Resistor Steps | 8 steps (Min. 100 mΩ, 10x stepping) |
| Initial Voltage Offset | 1 mV |