


📄 Source Paper
DOI: 10.1016/j.est.2026.121124
| Journal: Journal of Energy Storage, 2026
| Institutions: Mercedes-Benz AG
✓ Related IEST Equipment: IEST In-Situ Cell Swelling Testing System(SWE Series) · PRCD Foam Compression Force-Deformation Evaluation System
Pairing an NMC811 cathode with a silicon-carbon composite anode is a widely adopted approach to increasing the energy density of lithium-ion batteries. However, silicon particles can undergo volume expansion up to 300% during lithiation. As a result, Si/C cells exhibit two distinct types of thickness change during cycling:
Reversible swelling (cell breathing): Reversible expansion and contraction associated with lithiation/delithiation of the electrode materials.
Irreversible thickness growth: A progressive increase in cell thickness associated with degradation processes such as continued SEI growth, gas generation, and particle pulverization. Tracking this growth can provide insight into the progression of cell degradation.
High-precision in-situ swelling testing of silicon-carbon pouch cells is therefore indispensable for both electrode material development and battery module mechanical design. Importantly, the mechanical boundary conditions imposed by the test fixture can influence both the measured swelling response and the electrochemical behavior of the cell. Therefore, a rigid, non-compliant fixture may provide a mechanical environment that differs substantially from that of a practical battery module incorporating compliant buffer materials.
2.1 Cell Configuration
Two types of laboratory-made NMC811/graphite-Si/C pouch cells were evaluated using the same electrode formulations:
Cathode: NMC811, areal capacity of 3.8 mAh·cm⁻²
Anode: Graphite-Si/C composite, areal capacity of 4.5 mAh·cm⁻²
Type 1 (single-stack): 0.18 Ah nominal, 2-unit stack
Type 2 (multi-stack): 3.2 Ah nominal, 10-unit stack
After electrolyte filling and sealing, all cells underwent formation followed by long-term cycling at 25 °C, for a total of 408 cycles. Cell swelling and electrochemical performance were monitored throughout the test.
| Platform | Constraint Type | Role in Study |
|---|---|---|
| Pneumatic press | Rigid, no compliance | Reference group (conventional lab standard) |
| PCB eddy current sensor + foam | Compliant quasi-constant-force via buffer foam | Experimental group (module-representative) |
Before cell swelling testing, three polyurethane foams with different densities were evaluated through compression force-deflection (CFD) measurements. The purpose was to quantify their compression behavior and establish a reproducible mechanical boundary condition for subsequent cell testing. Based on the CFD characterization, Buffer foam 1, with a density of 500 kg·m⁻³, was selected for the subsequent experiments.
As the cell thickens during cycling, the buffer foam accommodates changes in cell thickness through compression, providing a more compliant mechanical boundary than rigid platens. Pressure-film measurements further showed that the foam promoted a more uniform pressure distribution across the cell surface, reducing localized pressure concentrations at the edges and corners.
The applied pressure also influenced both mechanical stability and cell performance. At 170 kPa, excessive foam deformation resulted in unstable pressure conditions, whereas 500 kPa excessively constrained cell breathing and was associated with greater capacity degradation over 408 cycles.
At 250 kPa, the foam operated within a relatively stable compression range with limited pressure fluctuation. This condition was therefore selected for the subsequent comparison between the PCB-based and pneumatic-press configurations.
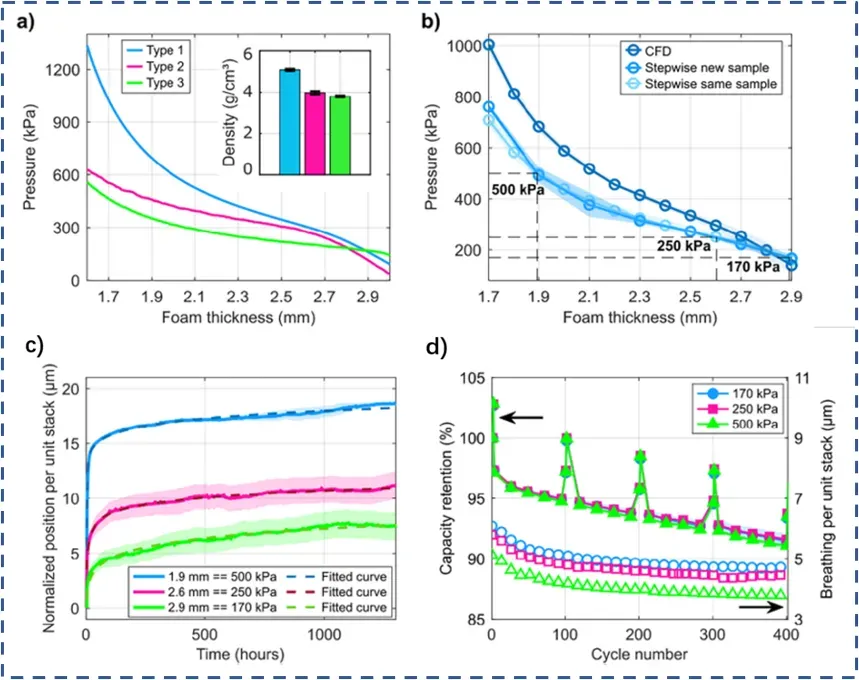
Figure 1. Mechanical characterization and cell-level evaluation of the buffer foam: (a) compression force-deflection (CFD) curves for the three foam types; (b) calibration methods for Foam 1; (c) long-term relaxation behavior; and (d) capacity retention (filled markers) and cell breathing amplitude (open markers) under different applied pressures.
At 250 kPa, the PCB-based and pneumatic-press configurations produced comparable swelling profiles over 408 cycles. The measured maximum thickness changes and cell-breathing amplitudes during formation and long-term cycling were within the experimental variability.
For offline validation, the single-stack swelling measured by the PCB platform deviated by only 2.8% from post-disassembly micrometer measurements and showed a trend consistent with electrode thickness changes observed by cross-sectional SEM. These results support the measurement reliability of the calibrated PCB-based platform under the conditions evaluated in this study.
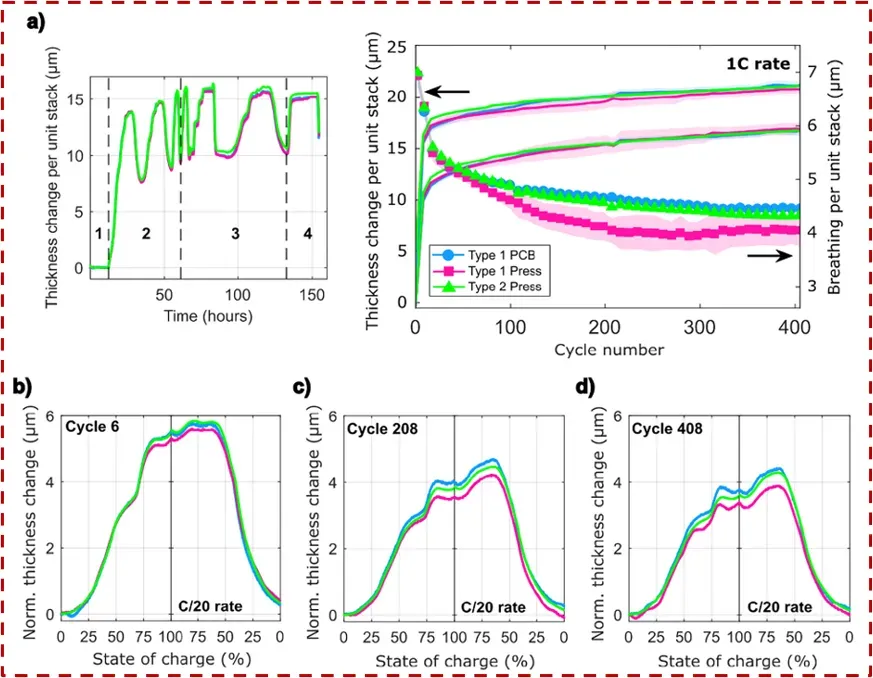
Figure 2. Swelling behavior measured using the PCB-based and pneumatic-press configurations at 250 kPa: (a) minimum and maximum thickness change per unit stack and cell-breathing amplitude over 408 cycles, with an enlarged view of the formation stage; normalized thickness change per unit stack at (b) cycle 6, (c) cycle 208, and (d) cycle 408.
| Parameter | Rigid Clamping (Pneumatic Press) | Buffer Foam at 250 kPa (PCB Platform) |
|---|---|---|
| Capacity retention (408 cycles) | Lower | +4% vs rigid |
| DCIR internal resistance increase | Larger increase | Smaller increase |
| Negative electrode lithium plating (post-cycle SEM) | Large-area Li plating observed | None observed |
| Electrode coating delamination | Present (SEM) | Intact electrodes, uniform SEI |
| Pressure distribution (pressure film) | Local high-pressure at corners | Uniform across full electrode area |
| Module relevance | Diverges from module mechanical boundary | Replicates real module foam constraint |
| Expansion measurement accuracy vs micrometer | — | 2.8% deviation (PCB+foam) |
After 408 cycles, the buffer-foam-constrained cells show 4% higher capacity retention relative to the rigid-press group, and lower DCIR internal resistance growth. Post-cycle SEM reveals large-area lithium plating on the negative electrode and coating delamination in rigid-press cells, while buffer-foam cells show intact electrodes, uniform SEI film, and significantly reduced localized aging risk.
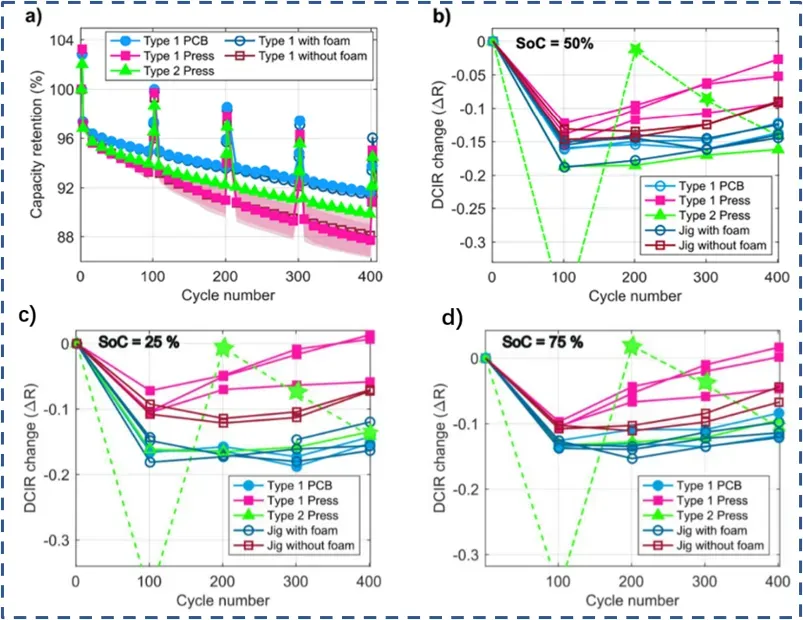
Figure 3. Electrochemical performance under different mechanical constraint conditions at 250 kPa: (a) capacity retention of Type 1 and Type 2 cells; (b–d) changes in DCIR at 50%, 25%, and 75% SOC, respectively. The Type 2 Press data include an outlier attributed to an incorrect four-wire connection.
Reversible cell breathing and irreversible thickness growth are important indicators of the mechanical evolution of silicon-carbon pouch cells during cycling. This study highlights four key findings:
Rigid, non-compliant fixtures may not fully represent practical module conditions. Pneumatic presses or other rigid-clamping fixtures do not replicate the compliant mechanical boundary of battery modules with buffer foam, which may limit the engineering relevance of the resulting swelling and degradation data.
Buffer foam is a key component for reproducing module compliant mechanical constraints. By promoting a more uniform pressure distribution across the cell surface, it helps mitigate lithium plating and electrode delamination during cycling.
Mechanical characterization of buffer foam is a prerequisite for standardized swelling testing. Variations in foam density and compression behavior can introduce differences in the applied mechanical constraint and compromise cross-batch data comparability. Therefore, pre-test foam characterization helps ensure reproducible and comparable swelling measurements.
Foam-buffered PCB eddy-current platforms can achieve swelling-measurement accuracy comparable to that of pneumatic presses. With appropriate stability calibration, such systems provide a viable approach for standardized swelling characterization of silicon-carbon cells.
In China, in-situ swelling testing has become an increasingly established characterization method for silicon-based and solid-state battery research. The IEST In-Situ Cell Swelling Testing System (SWE Series) provides thickness-measurement accuracy of up to ±1 μm, enabling high-resolution monitoring of cell breathing and irreversible thickness growth throughout cycling.
Comparing with the PCB eddy current sensing system described in the Mercedes-Benz study, high-precision displacement-based measurement systems can offer advantages in long-term stability. As noted in this study, PCB-based sensing may be affected by signal drift and calibration offsets during extended testing, potentially affecting measurement reliability over long cycling periods.

Figure 4. IEST SWE Series In-Situ Cell Swelling Testing System — applicable to silicon-carbon and silicon-anode pouch cell expansion characterization under controlled mechanical constraint.
Mechanical characterization of buffer foam is also becoming increasingly standardized among foam manufacturers. The IEST PRCD series can implement programmatic control of foam compression-decompression cycle evaluation at rates from 0.05 to 5 mm·min⁻¹, enabling quantitative evaluation of foam compression force-deflection behavior and cyclic mechanical response. Such measurements can support foam selection and mechanical calibration before the material is incorporated into cell swelling tests or battery module designs.
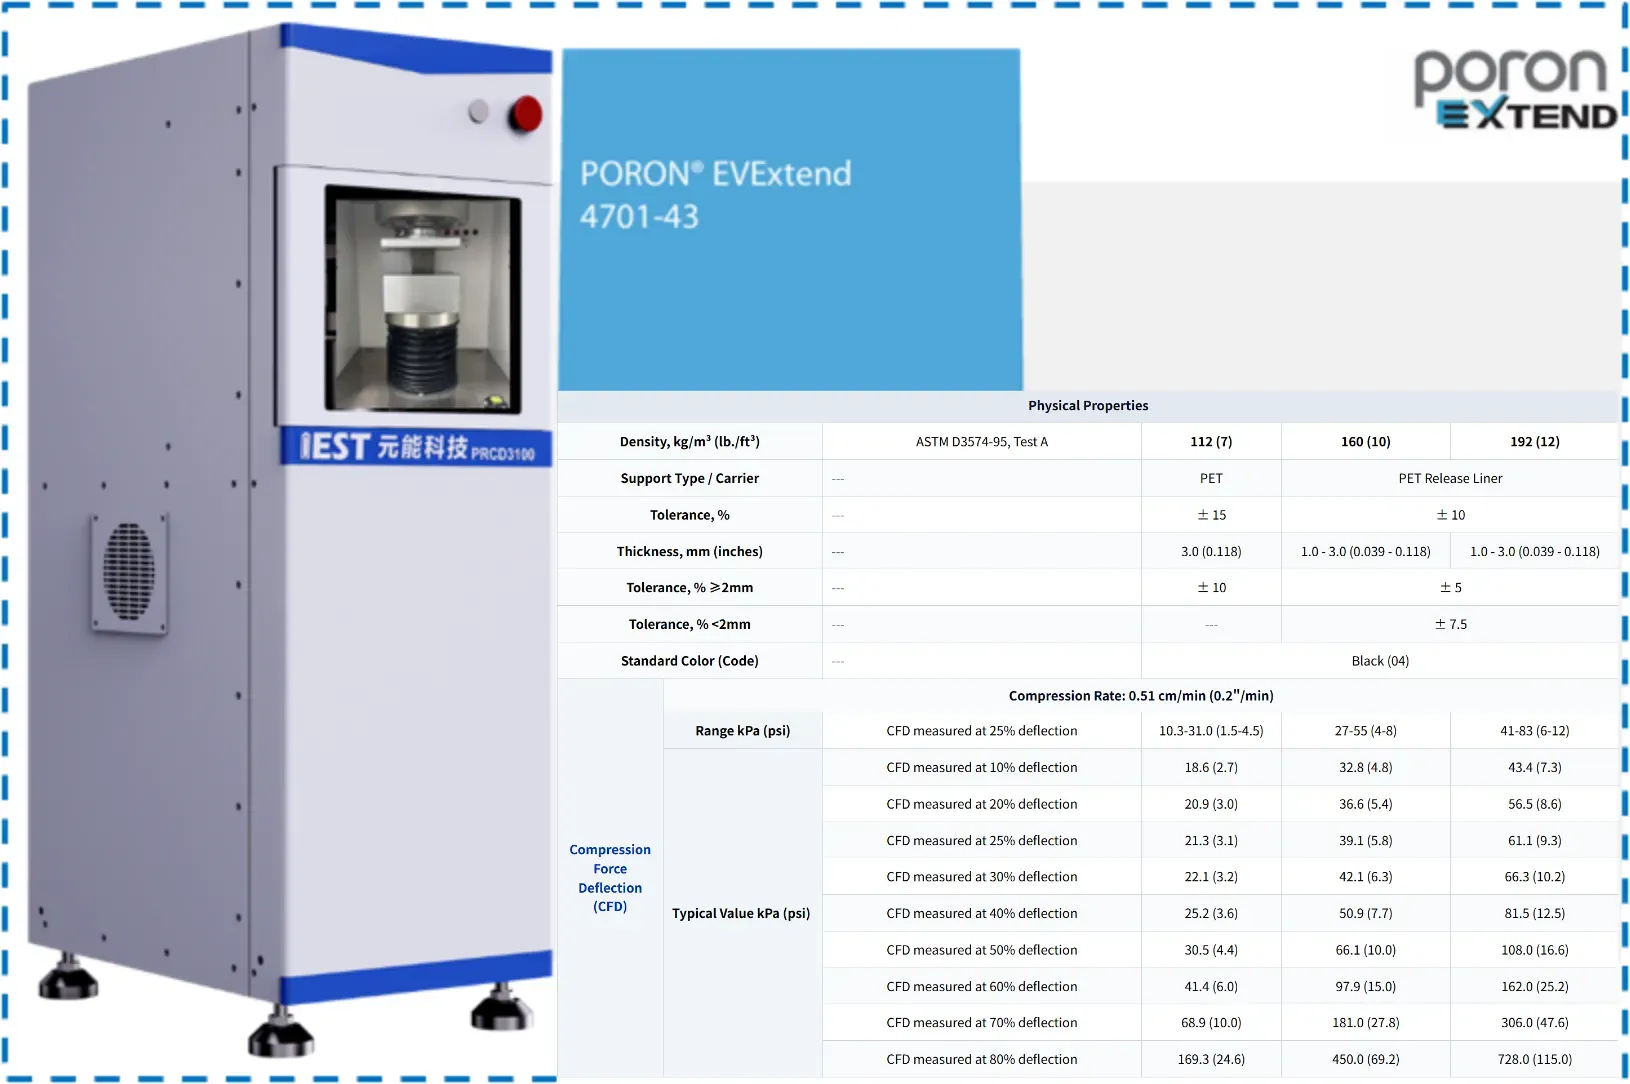
Figure 5. IEST PRCD Series Foam Compression Force-Deformation Evaluation System & PORON EVExtend 4701-43 foam performance data.
